A resource schedule tells you, your team, and those running the equipment exactly where they need to be and exactly what they need to be doing. It’s integral to bringing your projects to life. And for maintaining a perfect balance for resource usage. But just how detailed can the resource schedule get that doesn’t hamper productivity? Here we explore the techniques and tools needed to create a better schedule for your employees. All in a way that makes your team more productive, and without upsetting work-life balance.
What are the Benefits of Employee Scheduling in Project Management?
Project management without resource scheduling is really only half of the picture. What you got is a work breakdown structure (WBS) minus the guarantee those plans will ever come to fruition. And it’s only after a thoughtful allocation of resources that you can begin to put those plans into action.
It’s well known that scheduling time-constrained projects focuses on the optimal utilization of your workforce. Meaning when resourcing comes into play, the project schedule can begin accounting for capacity. And ensure that no one is under-allocated or over-utilized.
This allows you to stick to the actual project schedule – on time and within budget. From a management point of few it also helps build better team dynamics. Which in turn can help you see an Improvement in morale, boosts in productivity, and an increase in stakeholder satisfaction.
Steps to Making an Employee Schedule
- Create a central resource pool: This means laying out all possible resources. Including information pertaining to availability, skills, and other notable data that will make the scheduling process clearer.
- Draft a resource capacity plan: Identify exactly how much capacity there is available. Take into account working hours, other work commitments, and administrative tasks. Compare what you have in the resource pool with the project’s demands.
- Schedule the project: It’s important to indicate the deadlines and milestones of the project. As well as the WBS and tasks. After scheduling the project, it’s easier to see exactly where resources are needed.
- Allocate the resources: Once the planning stages are completed, it’s time to begin allocating tasks to resources. This process my need to be done more than a few times. To make it easier, keep in mind availability – as well as other factors that help match the right resource to the tasks.
- Keep an eye on utilization: Resource utilization is a helpful KPI to keep in mind throughout planning. While over-utilizing resources to the point of burnout is bad, it’s equally important to ensure that nothing is wasted or under-utilized. By tracking utilization you can learn to strike the perfect balance.
Techniques for Great Employee Scheduling
Scheduling resources often means you are maintaining a pretty tight schedule for your employees. Even more so if you are planning concurrent tasks while adjusting the utilization of each of them. It’s no wonder there are more tips for boosting productivity out there than one could count.
Here’s a few tried and true techniques for better employee scheduling that you can implement today!
Get Harder Tasks Out of the Way First
One of the important components of motivation is the actual energy to complete a task. That’s where a little flexibility in your employees’ schedules can work wonders. People work are the most productive if they have their own habit-based schedules.
For some, it might be that they are doing creative work right when they get to work. For others, brainstorming sessions might be something they want to start their day with. Although you can plan tasks with 15-minute accuracy in our resource scheduling tool, you shouldn’t go overboard with it if there isn’t actual need for that.
Now you might argue that minute to minute planning actually boosts productivity. Cal Newport said so, right? Well, planning your day out with that level of precision only works if you are doing it for yourself.
Buuuuuut… in general, people do tend to have more energy in the morning. So schedule the tasks that are more important or harder to complete to the first half of the day. Or just give your team the tip that the day will seem oh-so-much peachier if you do the hardest task first.

Match Tasks to Availability AND Skills
A resource schedule is more than a simple rundown of availability. Because every manager knows that it’s not just about the bodies. And a technique for scheduling the best resource for the job is looking beyond the work schedule. Instead it’s important to concentrate on your resources’ strong suits.
Once you have identified the type of resources that you need, organize them according to who will work on which tasks. This will help you better manage their workloads and make sure that everyone is working on something that aligns with his or her expertise.
For example, if one person is good at writing code but terrible at communicating with customers, then he shouldn’t be assigned to write customer support emails – even though he’s technically capable of doing so.
Identifying and matching resource skills to the task at hand will not only ensure that people are happier. Since they are assigned tasks that match up with their interests and strengths. But this practice also helps projects stay on course. Because you have the best doing the job.
Tip! In Ganttic you can import all employees and their skill sets that you have created in other software into the planner from a CSV file.
Schedule Short Meetings
Once more for the people in the back row. It’s still happening. There are too many long meetings that every team member has to attend. And those meetings? A huge productivity waste. The time that could be spent on completing tasks or taking a break, is spent on sitting in a stuffy meeting room. But we can’t go over that again. Learn how to master the art of productive meetings. But basically, schedule meetings that are short and have a clear and strict agenda.
Don’t Mistake Busyness for Productivity
There isn’t a trophy for the person with the longest to-do list. Although there definitely is a cultural emphasis on the moral value of being a person with a busy schedule. There also isn’t a trophy for a manager that schedules their employees with the most tasks. Only resentment amongst team members. Whereas there are some definite pros to finishing a project ahead of its schedule.
Keep in mind that your team isn’t made up of robots. If it is – I’m seriously jealous. Even if you’d like to think that they are working 8 hours straight, you know that it isn’t actually the case. Having too many tasks planned out for the day will hurt productivity since you can’t really have it all. And inevitably tasks will fall behind schedule.
The Zeigarnik effect will kick in and the tasks that aren’t complete will seem much more important than the ones that are. Stress will increase. To fix it, your team might thrive for getting it done with some overtime. Since overtime comes at the expense of leisure time or what even worse, sleep, it will decrease productivity during the next days as well.
So a better technique to get the most out of your employee schedule is looking at and adjusting utilization as you go. Schedule short tasks. Or even part-time tasks. But ensure along the way that no one is being overburdened and overworked.
Real Life Case Study
The engineers over at Innopolis Engineering know a thing or 2 about busy schedules. And they know from experience that scheduling 8 hour daily tasks, won’t make you as productive as you think. As they explain:
“I guess in resource planning many project managers make the mistake of booking people at full capacity. However, in reality, employees get sick, or they have inspirational coffee breaks, trainings, or different courses. This means that on average people work 6.5-7 hours per day, not the full 8 hours. Taking that into consideration, I have set the work time to 7 hours in Ganttic.”
Get some more resource scheduling advice from our case study.
Be the Scheduling Sensei
When scheduling tasks, leave some room for flexibility. Schedule more all-day tasks or even all-weekly tasks concurrently so that every person can shape their own schedule around their habits and preferences. Giving your team the freedom to shape their daily schedule and leading them to better planning is a quick fix with big results!
Even if you build a schedule that’s perfect, and your team seems to be always working on their tasks, your project might fall behind its schedule. So what’s going on? Well, it’s important to remember that someone that is sitting at their desk for 8 hours might not be the most productive one.
To fix this, you can try to become the productivity sensei. And leading by example is always a good idea.
You can definitely guide your team to more productive time planning practices. If you are making a change towards more flexible resource scheduling, make sure to let your team know why that is (with a short meeting, hehe). Teach yourself about the Pomodoro Technique and time blocking and every other time management technique out there. Share the knowledge. Make planning your day out ∼cool∼.
#1 Technique – Get Some Employee Scheduling Software
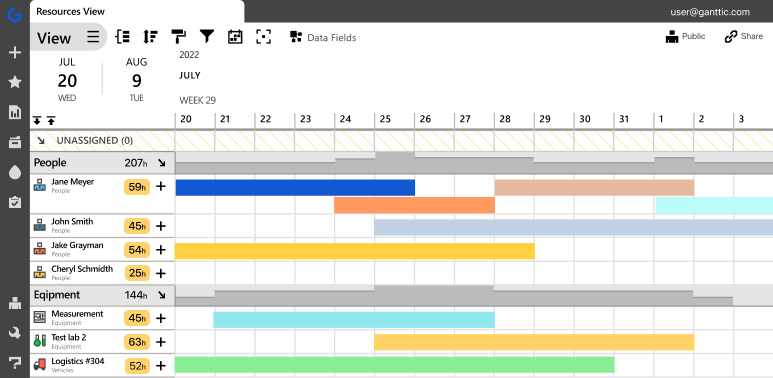 A clear employee scheduling tool like Ganttic shows you where your people are and what they are working on.
Along with the techniques and tips we mentioned here the best technique for a more productive employee schedule is to get a tool to help with process. Dedicated resource scheduling software not only speeds up scheduling, with features that help automate the process. But with the right tool, you can maintain better control. Check out all the features that Ganttic has to offer.
- Drag and drop tasks to employees – quick scheduling for resource allocation.
- Visual Gantt charts – give an overview of the project resource schedule with a more timeline for completion
- Data fields – add in useful information about projects, tasks, and resources and always schedule the right resource for the job.
- Excel import – upload your old spreadsheet templates and begin automating your scheduling.
- Get started today with a free trial. Take advantage of unlimited personal demos to help with setup and finding the workflow that fits you.