Our latest updates have been made to make Ganttic more user-friendly and intuitive – especially in the VIEW settings, one of the most commonly used features.
Ganttic is constantly changing. Thanks to our users’ feedback, we can get a better understanding of the main challenges within the planning world. This also helps to make Ganttic’s planner more convenient to use. We always appreciate your feedback.
VIEW, Apply, Save
Ganttic’s Views are the feature that actually takes your Ganttic planning experience to the next level and really, as the name implies, gives you an overview. Of anything. Your resources. Your projects. Your timeline. Any filtered information that is of interest to you. And with this update, we encourage you to use them even more.
Here in Ganttic you have an opportunity to see and manage separate view tabs of:
Filter out and group the information you need. In the order you need. In the amount you need. For the timeframe you need. That is how to handle and schedule really big data, different data, several projects and all your resources. At one place!
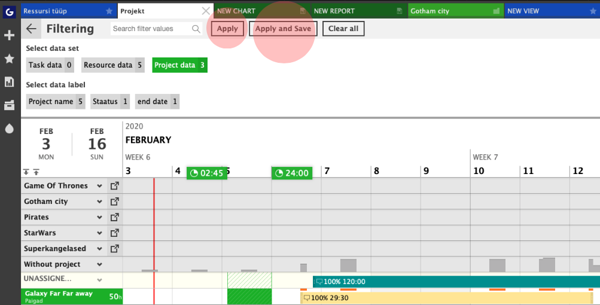
To make your life easier when choosing customized projects, apply filters and find the perfect way your “view” should look. We now have 2 options for you:
- Apply: Gives you the opportunity to apply a chosen info flow (filters/sortings/groupings) and utilize the needed data to look at it while working.
- Apply and save: Allows you to actually save the filters and chosen sortings/groupings. This will be how the view will look next time you open it. Make sure to give the “view” the name that helps you to find it easily next time you open it.
No more switching between the menus to save your changes. Now the button is next to the actual data.
TIP: You can seriously use an unlimited number of “views.” Take advantage of them to divide your tasks, resources and projects into more manageable pieces.
With this small update we encourage you to create even more “views” and use them to plan smarter!
TIP 2 : “Views” are also possible to share with your colleagues, the board or external parties with simple URL. This is an amazing way to share real-time info in a visual way. No need for printouts – be quicker, save time and resources, and use the “real-time” options.
Projects can be shared with views as well.
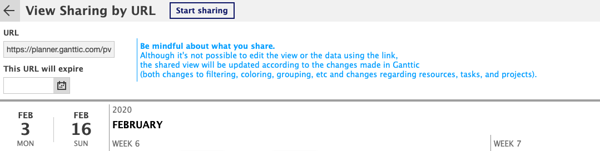 You can also share different views with colleagues, external parties or shareholders. They change real time and give an overview.
Single Project Views: Use The Full potential
We also made a few intuitive changes in our “Single Project Views” to optimize their toolbar. Single project views are handy to focus on one project, but lets you keep an eye on how it relates to others as well. They are a must-use feature for project portfolio managers.
We have noticed while talking and meeting our clients, that perhaps some of the icons were a bit too hidden from the general “view.” So we did our best to make them easier to notice and use for your needs. Here’s a quick rundown of what these icons can do:
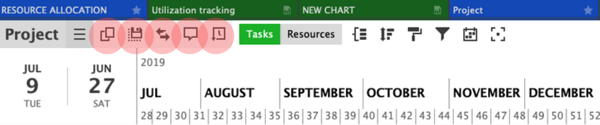
Moreover, you are able to group and filter your data, as well choose different colors for better organization. You can also change the time and visibility settings of the current view.
TIP: Also try to switch between Resource & Task “views” (see the buttons to actually make it happen) within your single project “view.” This allows you to analyze your data from totally different angles by getting it from your resources or the Gantt Chart. Use this to actually track the task timeline throughout the project.
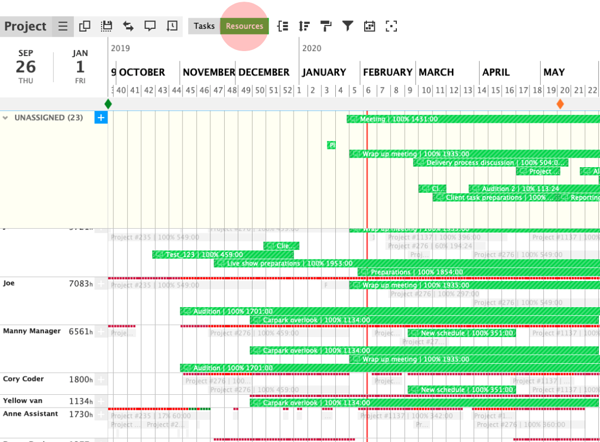 Ganttic single project view – resources
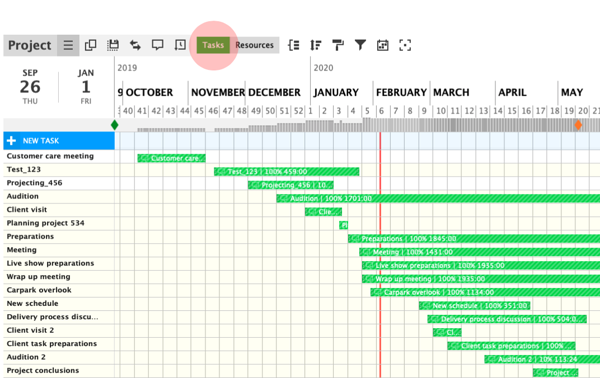 Ganttic single project view – task angle.
Reports – optimizing the reporting process with easy drag and drop
I think we all agree that automatically generated reports are an amazing way to lighten our work loads. Especially when there’s an opportunity to make automated reports that are sent to you at the time interval you wish.
Reports are also important to understand and analyze the processes, results, and even plan the future. We have a feeling that reports contain a lot of untapped potential. So we wanted to make the reporting system more intuitive and even simpler.
Now you do not need to click around to see where, how and what to add to report. It’s as simple as drag and dropping is for making the schedules. To make a report, just follow these 7 easy steps:
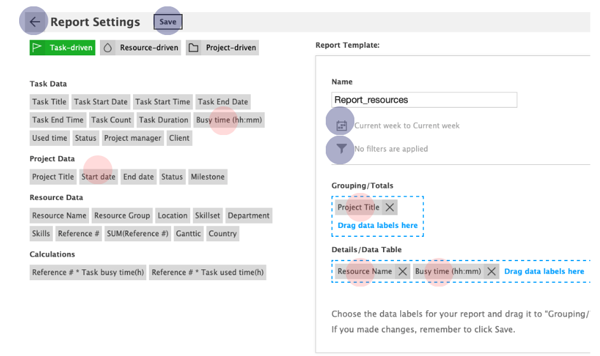 Add the data that is interesting for you. The example is just to give an idea about the groupings and details in the report.
- Name the report whatever you like.
- Choose the report focus: Task-driven, Resource-driven or Project driven.
- Choose the data you would like to group and get totals about, and/or the table data which adds more details.
- Just drag and drop it within “Grouping/Totals” or “Details/Data Table.”
- SAVE the result.
- Add the particular dates and filters you need.
- Analyze your report data.
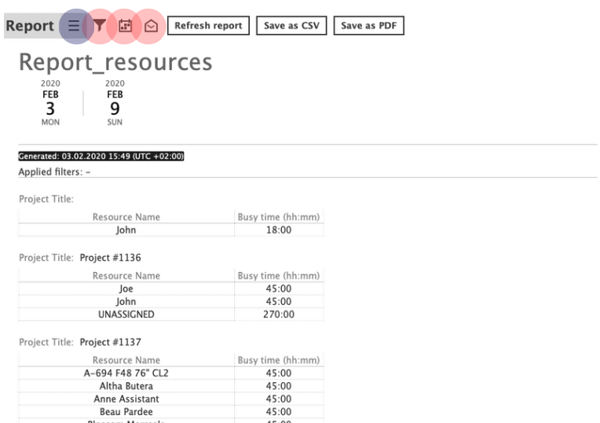 You can change the Resource dates, filtering and automatisation from the Report toolbar. Your report will appear in the report section.
EXTRA: if you like to change the data labels, go back to report setting menu by clicking the menu icon.Reports simply can not be made any easier. Once you find the ones that can benefit you, automate them so they can be sent to you on either a daily, weekly or monthly basis.
Your case and your questions
We know that every Ganttic user plans different data and uses different features. While these unlimited possibilities are great for some, it may be overwhelming for others. That’s why we encourage you to ask for help. Whether you’re stuck with a planning question or you can’t figure out some features, our helpdesk is always there for you.
We can solve your problems, give you some tips, as well as receive valuable feedback that can be used for future updates.
Write to our helpdesk or book a 1-to-1 demo to get the full picture of Ganttic. We’re all about more effective planning.