Gantt charts are there to make project management and resource allocation simple.
A visual planning tool that’s easy to comprehend. They are beloved for the worldwide for the simplicity they provide to project managers. But, how do these tools, known for project planning and task scheduling fare to something as complicated as resource management? Are Gantt charts still the tool for you?
The answer is yes! A resource Gantt chart is possible. And this article will explain how you can begin integrating this tool into your project resource management.
What is a resource Gantt chart?
A resource Gantt chart takes the traditional project management tool Henry Gantt created more than 100 years ago, and turns it on its head. While it provides a visual overview of project tasks in the portfolio, it does so from the POV of resources. Meaning all tasks and projects are extensions of the resources’ timelines.
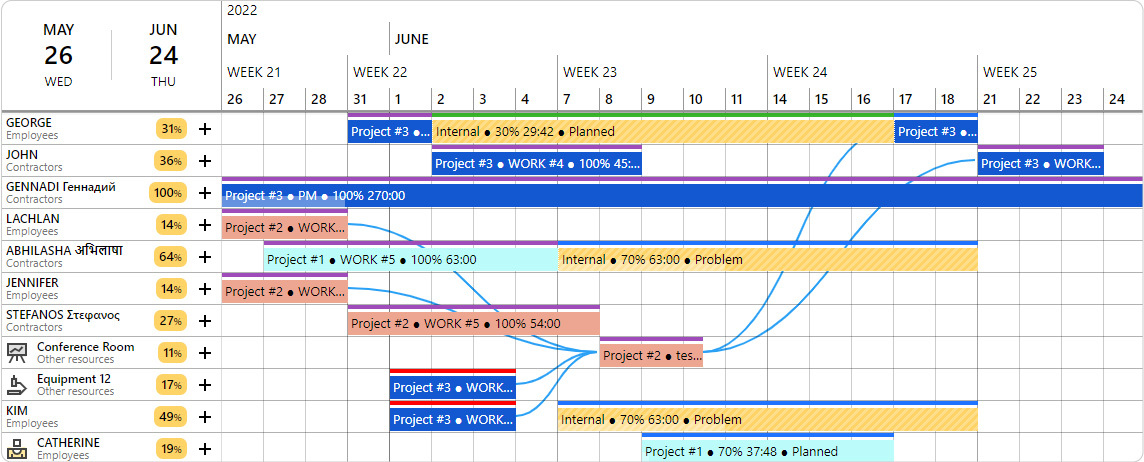
This can be illustrated in the image below
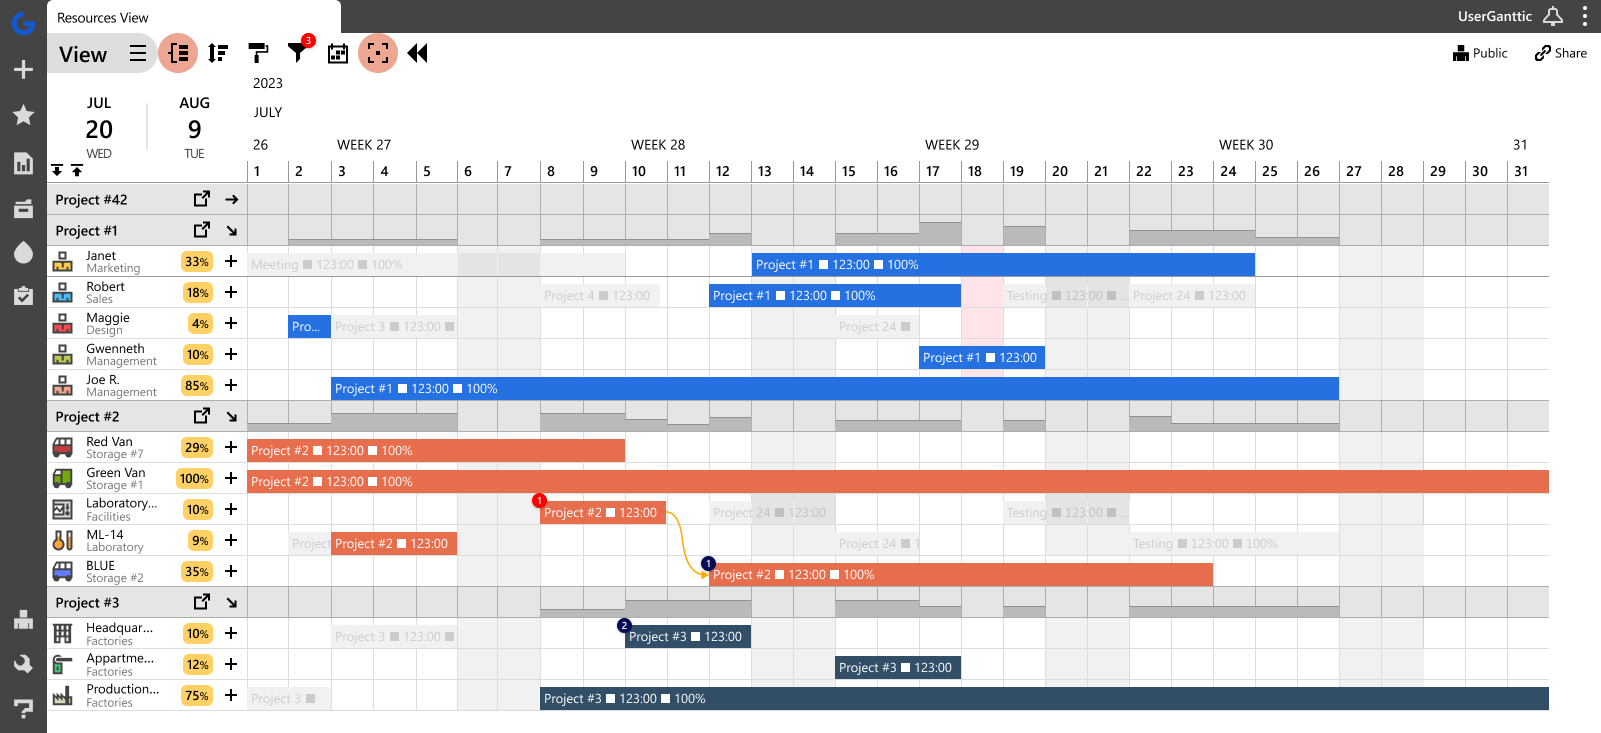 A resource Gantt chart created in Ganttic.
In the resource chart above, the resources’ tasks are allocated directly onto the timeline. Making it easy to see immediately, who is doing what, and until when.
While a traditional Gantt chart is done from the project’s perspective. Instead of seeing those responsible for the tasks, it’s more interested in the project’s work breakdown structure.
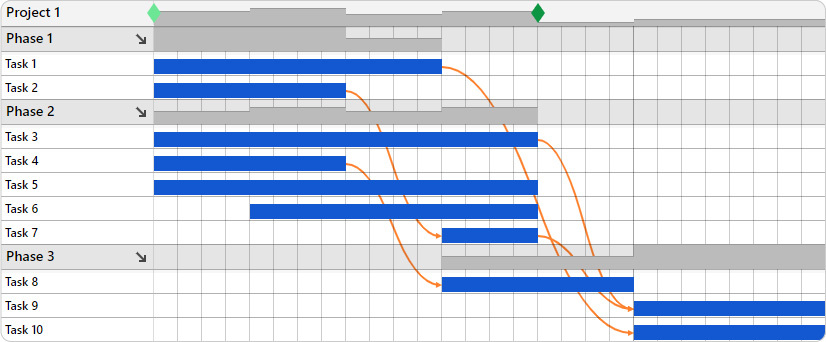 A traditional Gantt chart also created in Ganttic.
Comparing a resource Gantt chart to the traditional one, the difference is obvious. And whichever one you decide to go with depends on workflow and work needs.
Luckily, many online Gantt charts also give you the ability to allocate personnel or equipment to these projects and tasks. Or better still, flip back and forth between the chart that is needed.
This is considered a more holistic approach to project management, as it provides an overview of your entire operation. And making it even easier to accomplish project scheduling with Gantt charts, as well as resource planning.
How to make a resource chart?
There’s several key elements to include if you’re using Gantt charts for project resource management. These include:
- Projects Dates and Timeline – The complete project time frame is right at your fingertips. Including: milestones, task start and end dates, and project deadlines.
- Projects and Task Bars – The actual “meat” of the Gantt chart. These bars visually represent what projects and tasks are in the works.
- Resources – These are the “who” of the project schedule. Resources are the people, tools, and equipment carrying out the project objectives.
- Dependencies – These are the visual cues that show relationships between tasks. Which needs to happen first before something else can start – dependencies provide the answer.
How do you use a resource planning chart?
So we have a basic chart and it’s great. But what if we want to include some additional info? Such as: project status, who the project manager is, or the project reference number. Maybe you also want to add a link to relevant documentation, such as a proposal or Google Map. As well as a note regarding the task to another project manager.
If you were using a Gantt chart template in Excel, maybe you could color some cells to book resources. And in that same area you can add the status and reference number. But the more you add, the more you realize that not everything will fit. So what do you do?
Well, if you’re emailing out this Gantt schedule, you can just add the link and the comment to the email. At least it’s there. And then just pray that the recipient actually reads your comments and attachments. I mean, it could happen…
That’s why project managers and resourcing teams typically prefer Gantt chart software to an ad hoc one made in Sheets or Excel. Because they give you a choice of keeping it simple, or getting as complex as your work requires.
Benefits of using resource charts
By integrating resource allocation into Gantt charts, project managers can make their job of resource management easier and less time consuming. Not only does visualizing their resource schedules prevent overbookings and potential hiccups, but the built-in flexibility of Gantt charts make it easy to adapt to other changes.
Here’s a few of the tangible benefits that come with using resource-based Gantt charts.
Real-time resource tracking
One of the best things about Gantt charts is the way they provide a centralized platform for tracking resource allocation and availability in real-time.
This is incredibly helpful in cases where resource constraints or conflicts arise. As having a transparent visualization of resource assignments can help with collaborative problem-solving. Team leads or resource managers can easily identify potential bottlenecks or overlaps and work together to find solutions. That way ensuring that projects stay on track.
Engineering firm Pure Technologies is a real life example of how useful this real time tracking can be. Having used Ganttic’s resource-centric platform for the past 10 years to track equipment, which is oftentimes spread across North America. In doing so, Regional Director Allison Stroebele has pointed out how this has helped maintaining operational efficiency:
“We’re more efficient in our jobs. We can track at least 80 pieces of equipment now as well, which wasn’t practical previously. As soon as we started using Ganttic, our tool support people said, ‘This is awesome, we can track every single piece of equipment. We can keep track of where everything is in real-time.’ So it gives everybody better visibility on where equipment and technicians are and what they’re doing.”
Pure Technologies Regional Director Allison Stroebele
Real-time tracking is something that’s best done when you have a live Gantt chart that’s available to the whole team. So in order to take advantage of this, then it’s better to make the switch from a spreadsheet to a cloud-based app which allows more users and real-time tracking.
Improves communication
Gantt charts are visual by nature. And this clear visualization of resource assignments and schedules promotes better communication among project team members. Which subsequently leads to a reduction in misunderstandings and delays.
That’s because Gantt charts provide a centralized platform where project team leads and members can easily access and understand their schedules. Each person can quickly grasp who is responsible for what task and when it needs to be completed. Which is turn fosters transparency and clarity in project communication.
With resource allocations clearly laid out in the Gantt chart, project team members have a shared understanding of project timelines and resource availability. This alignment of expectations ensures that everyone is on the same page regarding project progress and resource requirements. And if something in the plan changes, then online Gantt chart makers also helps them update and notify team members faster than an email thread. Plus, in opposition to static Gantt charts in Excel, these timely updates can prevent confusion. Enabling team members to adapt their plans accordingly and act as needed.
Prevents project delays
Resource allocation is not a one and done kind of job. New priorities arise, people get sick, or projects may need to be pushed back. But by visualizing resource utilization alongside project timelines, project managers can make informed decisions about how to act in these situations. As well as prepare them on better optimizing resource allocation and preventing future bottlenecks.
By regularly reviewing these visual resource plans, managers can identify opportunities for optimizing resource utilization and minimizing down time. This not only ensures that nobody is overworked and no machine is sitting idle for too long, but it guarantees that the deadlines you’ve promised to a client can be smoothly met.
And when your Gantt chart has built-in milestones, then you can know immediately that an important deadline is on the horizon. Making it easier to plan ahead with more resources before crunch time approaches.
Steps to creating a resource Gantt chart
When project and resource managers leverage the power of Gantt charts, many opportunities arise for streamlining project execution. As well as ensuring the efficient utilization of resources throughout the project lifecycle. Here’s a few tips for using a Gantt chart for your own resource allocation process.
Step 1: Add resources
Assigning resources to specific tasks within the Gantt chart allows for easy identification of personnel, tools, and equipment required for each project phase.
Let’s take the following use case:
Maybe you’re looking to book a bulldozer for a project located in Detroit.
Since you also want to keep track of the equipment, and book it for use, you can add this information directly to the resource on your Gantt chart. By utilizing custom data fields, add the machine’s location and reference number. Once the project manager in clicks on the resource, they’ll know that it’s the piece of equipment in Michigan with the reference number 57008.
This makes it easy to create a working capacity plan and ensure that the right resource is booked for the job. Since they’ll see right away which piece of machinery they are booking. And not accidentally scheduling the wrong one located in Chicago.
All the data is there, out in the open. And for Gantt chart software that accommodates both human and non-human resources, this scenario applies to whatever you’re planning! Making it easier for managers to use it and allocate resources.

Step 2: Get an overview of resource availability
Integrating resource schedules alongside project timelines is one surefire way to stay ahead of potential resourcing conflicts. And a visual resource allocation tool can help eliminate the chance of double-booking the same person or piece of equipment for separate jobs.
But in addition to visually spotting these resourcing conflicts, Gantt chart resource planning software also has the ability to show you some deeper utilization metrics.
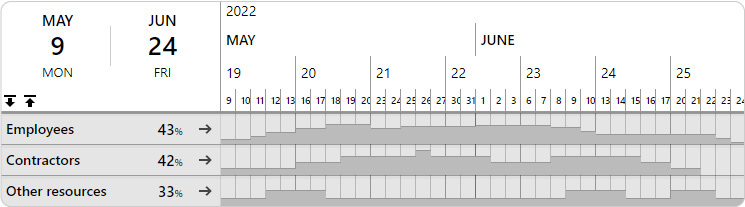
Get an exact overview of your team members’ planned and used times. Compare these metrics across days, weeks, or months and see how your utilization has improved or changed.
Some managers may also prefer to compare availability across teams, departments, or branches. In Ganttic, you can group resources by these different parameters and get the weighted average across the group. There’s also activity graphs and heat maps to visually pinpoint when there’s a rush on resource demands.
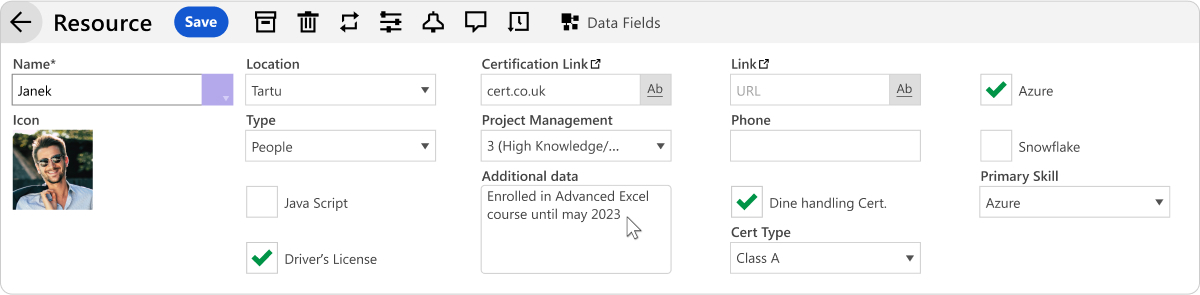
Step 3: Add key details like skills, roles, and pay
If you are in charge of a resourcing department then you know that one of the top things you need to be aware of is who you are scheduling. And what kind of skills, tech stacks, or certifications your resources possess. This information is crucial for project management, as it gives you the opportunity to put the best people on all the projects that are lined up.
While this information is necessary, it can also start to get unwieldy if it’s not properly organized or put to its best use. But in project and resource management Gantt charts, you can keep your scheduling simple, while also filling your tool with all your important data.
If you are staffing projects, you can add the location where the resource is based, in addition to their certifications, driver’s license types, skills, position, or even hourly rate.
This information can be sorted, grouped, or filtered in order to find the right person to fill the role.
Step 4: Allocate tasks to resources
On a resource chart, adding tasks are the simplest part. That’s because the allocation can be down with a quick drag and drop.
Start by selecting the resource you want to assign a task to, then click on the timeline where you want the task to begin. Enter details such as the task name, start and end dates, and any specific notes or data fields that keep your team informed.
With drag-and-drop functionality, tasks can be easily adjusted to reflect changing schedules or priorities, giving you flexible, real-time control over your resource allocation.
If you don’t know who you’d like to work on your task, then there’s also he option of creating unassigned tasks. That way all the jobs are laid out on the timeline. Once you begin resourcing, just drag and drop the task to the right person.
Step 5: Personalize and segment your Gantt charts
Sometimes everyone needs a new perspective in order to see things more clearly. When resource planning, it’s especially important to take a step back and pare down some data. That way you have clearer insights into your allocations, utilizations, and overall schedule.
In order to do this, consider some of the features online Gantt charts have to help with big data. You can use the information you have added to group resources, filter them, and create all sorts of saveable and shareable Views.
Views of resource allocation at a specific location. Or a View of crew members who hold a specific certification. Simply filter out the information that’s relevant and save what you see as a View.
Step 6: Asses priorities with task dependencies
The visual nature of Gantt charts extend far beyond simple resource schedules. As noted above, you can get direct insights into utilization and availability of your team.
But another benefit of Gantt chart scheduling is their ability to prioritize your workflow. These simple lines can help you see whether the work should be completed ASAP or if it can be moved back. And what will this affect if either scenario plays out.
Moreover, mapping dependencies within the Gantt chart helps in sequencing tasks effectively. And ensuring that resources are allocated in accordance with task priorities.
Resource Gantt charts VS. project Gantt charts: case study from Sunstall

It’s important to note that resource planning doesn’t happen in a vacuum. The reason for its existence is rooted in finding the best and available resources for your projects. Leading to the age old question: do you need a resource Gantt chart or the traditional project-based chart?
Well, the answer is you can have both! As was found out by Ganttic’s long-term client, Sunstall. In order to plan out their projects’ workforce and equipment, it was becoming glaringly obvious to CEO and co-founder Helge Biernath, that they needed both versions to get their solar installation projects running smoothly.
“Before I couldn’t find anything that showed both – the Resource View, which could be compared side-by-side to the Project View. The other options were typical Gantt charts that showed tasks, whereas Ganttic was more resource-centric. And it allowed us to jump back and forth between the two.“
Sunstall CEO and co-founder Helge Biernath
With just a click of the mouse, it’s possible to switch between a Project View and a Resource View. Allowing you to get a complete picture of how your business activities are progressing. Check on your Resource View when you want to see what your team and vehicles are working on. Or to get an eye on the big-picture or for reports on client timelines, you can switch to the All Project Portfolio View. Take a look at the video below which showcases the difference between these Views.
Simplify Gantt chart resource planning
Ganttic is online Gantt chart software that makes it easy to turn even the most complex project schedule into something that simple to create, interpret, and accomplish.
Sign up for a free demo and we can show you how to get started with Ganttic’s custom data fields. Amplify your planning by streamlining your work processes.