Gantt charts for resource planning
Software which concentrates on resource planning is great if you only need them for simple resource scheduling. The same goes for those who are looking for a way to plan and book tasks for the people, tools, equipment in one organized location.
When on the hunt for resource-based Gantt charts, look out for features such as drag and drop scheduling, utilization tracking, and adjustable permissions.
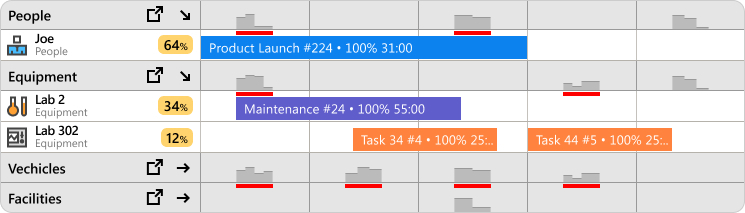 In Ganttic, you can get utilization metrics for individual resources and groups.
Gantt charts for project management
Perhaps project planning is your forte. In this case, you need to be able to schedule projects according to your timeline. As well as the dependencies, tasks, and resources associated with the project.
But once you get to a higher level of planning, you may need to seek out specific project planning Gantt charts. Dynamic timelines, project grouping, and project data fields are all important features to be a successful project manager. And can help juggle multiple projects at once.
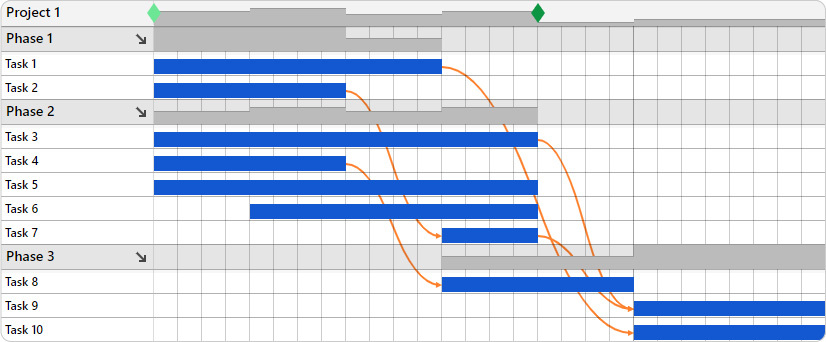 Track your project phases with visual dependencies.
Gantt charts that focus on project and resources
Even better than choosing between resource planning and project portfolio management is when you find smart software that can do both!
Specialized matrix planning tools allow users to go back and forth between resource-based and project-based charts. Create a View of resources and one of projects. This helps provide a more comprehensive picture of both your projects and the resources assigned to them.
This dual approach adapts to how different project managers actually work. You can book resources for specific tasks immediately, or build out the project timeline first with deadlines and unassigned tasks to allocate later. This flexibility not only fits your natural workflow but also ensures no equipment or team member is ever overbooked.
Question #2: What are your collaborative and sharing needs?
Almost every Gantt chart tool offers some form of collaboration, but it is important to evaluate what your team actually needs. Software overloaded with live chat, file sharing, and brainstorming boards can create an unnecessary learning curve if you only require simple notes and task comments.
You also need to consider your management structure. Whether your entire team actively updates the schedule or a single manager controls the board, you need a straightforward way to share the finalized plan without overcomplicating the daily workflow.
In that case, be on the lookout for Gantt chart makers which allow unlimited users. Ganttic’s resource-based pricing allows you to add as many users as you want. That way, your plans aren’t dependent on who has a software license.
You can also share the chart with non-users. You can create open-access URL views easily in Ganttic.
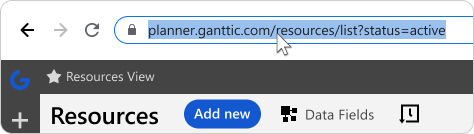 In Ganttic, you can easily share your Gantt charts with users and non-users.
Question #3: Big picture planning or specific details?
Gantt charts breakdown complex info in a way you can easily absorb. But what kind of info does your chart need to contain?
When it comes to simple scheduling, you may only require the timeframe and the name of the booked resource. The project or task name can also come in handy sometimes.
For strategic resource management, it helps to add specific details to your resource profiles. Locations, skills, and hourly rates are common data fields, but depending on your industry, you might also need to track time zones, spoken languages, or even uniform sizes.
Project portfolio management (PPM) requires specific data to keep timelines on track, including start and end dates, client details, and manager contacts. Evaluate the exact level of detail your team actually needs. The most effective software gives you the flexibility to be as granular as necessary, providing exactly the right amount of information without cluttering your workflow.
 In Ganttic, you can create visual heatmaps of which resources are busiest across the portfolio.
Custom data fields allow you to attach vital details directly to your resources, projects, and tasks. In Ganttic, you can add these fields to any element on your chart to track specific information that rigid Excel templates simply cannot handle. This keeps your critical context centralized rather than scattered across disconnected spreadsheets and message threads.
Instead of manually typing out updates, you can build your schedule using drag and drop planning. Managers can quickly select variables from drop-down menus, add reference numbers, and attach specific notes before saving.
The result is a fully customizable Gantt chart that remains visually simple while housing complex operational data. Your team gets exactly the context they need without extra spreadsheets, endless emails, or missing information.
Task Data
Custom data fields do more than just store information. Once added to your Gantt chart, you can instantly filter your schedule based on these specific details or apply custom color coding to highlight critical data across your entire portfolio.
Resources

Resource custom data fields are the most used ones. If you are staffing projects, you can add the location where the resource is based, in addition to their certifications, driver’s license types, skills, position, or even hourly rate.
With Ganttic, resources can represent anything from personnel to heavy equipment. When managing tools or machinery, you can attach specific details like reference numbers, weight classes, and upcoming inspection dates directly to the resource profile.
For example, you may need to book a piece of equipment located in Dallas, you can add its location and reference number as separate custom data fields. When a project manager clicks on the resource, they immediately see they are viewing the Dallas unit with reference number 35750.
This level of detail ensures the correct item is booked for the job. Managers instantly know exactly which piece of machinery they are scheduling, preventing them from accidentally reserving a similar unit located in New York.
Taking customization a step further:
You can use the information you have added to group resources, filter them, and create all sorts of views. Views of resource allocation at a location, in a department. You can filter out a type of equipment and save what you see as a view.
You can also use resource custom data fields for calculations using reports. You can make reports calculate how much to pay to a specialist etc.
Projects
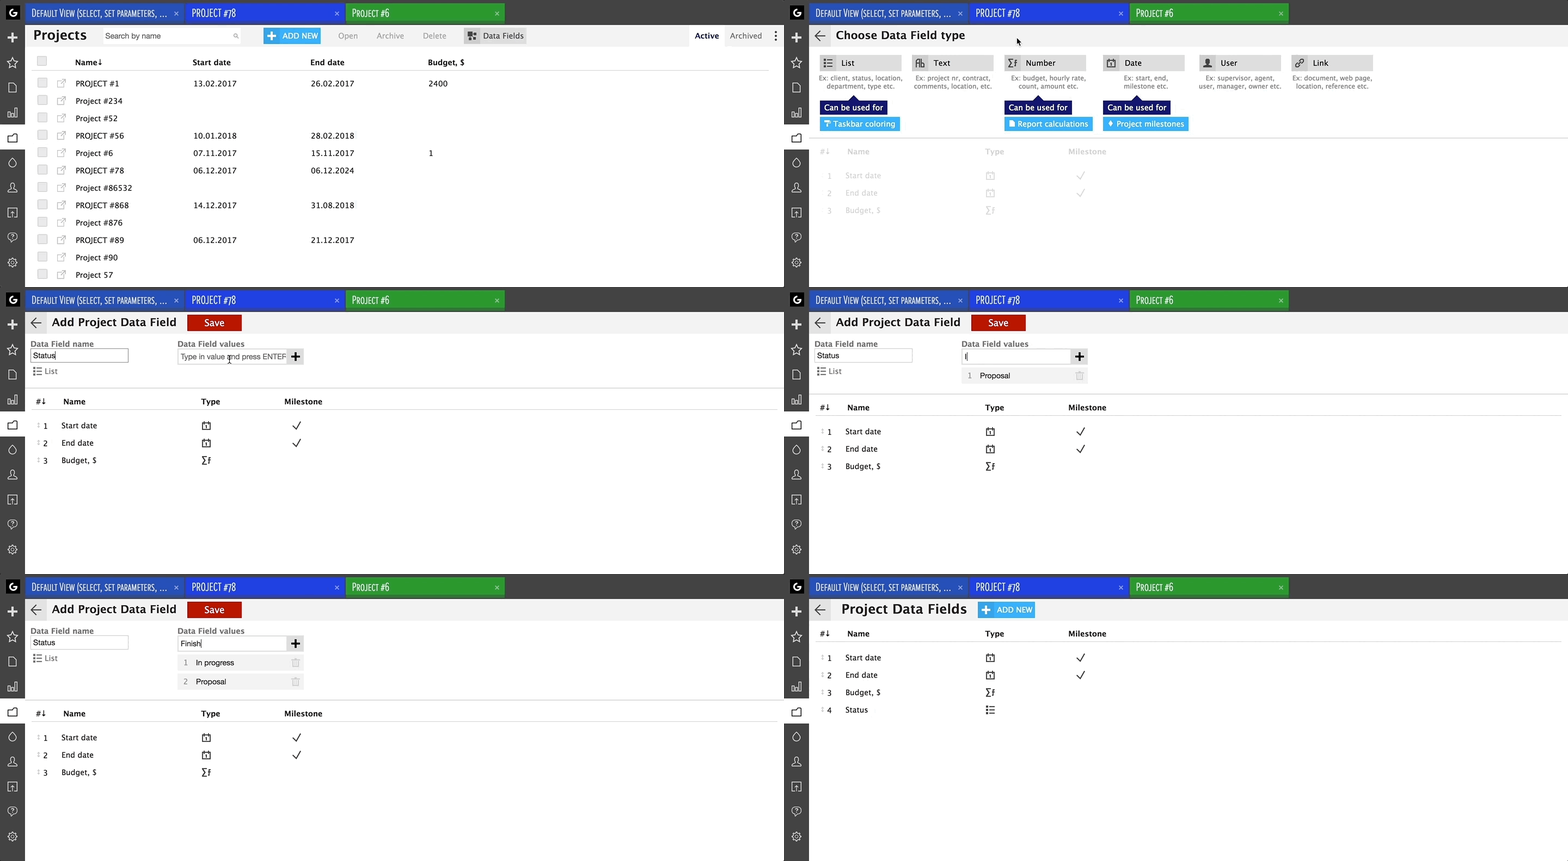
Project custom data fields come in handy if you are working with some other management tools alongside Ganttic.
Let’s say, the sales team just submitted a proposal for a project. It’s in the system, but you need to check resource availability. You add the project, copy the project reference number, choose the location and the department from the drop-down menu. You choose proposal for the project status and choose yourself as the project manager that’s in control of the project.
Other managers will instantaneously see if you start dragging and dropping Gantt charts to book resources for the project. The whole story can be told without Excel spreadsheets and email threads.
Take it a step further:
Project custom data fields, namely date type project custom fields, are where to go if you need to add milestones to your projects.
Just make sure the ‘Show as milestone’ button says ‘ON’, and the dates you choose for each project will be displayed as milestones on the Gantt chart area. If you are using sync to marry Google Calendar and Gantt charts, you can sync the location of the event through link type custom data fields.
You can also assign a color to every status on the list, and you can use those colors to get a quick overview of your project statuses.
Your scheduling software should handle the heavy lifting of team communication. A reliable Gantt chart needs to connect directly with the tools your team already uses. Syncing your schedule with Google Calendar or Outlook ensures everyone receives automatic notifications about upcoming deadlines, eliminating the need for manual follow-ups.
If you need to link your planning board to a broader tech stack, such as your CRM or ERP system, look for software that supports custom workflows. Platforms offering an open API or Zapier integration give you the flexibility to bridge your operational data exactly how you need it.
Question #6: How much time do you want to save?
Three basic examples of time-saving features widely used are recurring tasks, project templates, and automatic reports.
Recurring Tasks
How often do you have the same tasks that appear week after week? How much time does it take to plan these tasks?
If your workflow involves recurring tasks, choose a tool that allows you to quickly duplicate assignments or set them to recur automatically. This keeps your daily, weekly, and monthly planning sessions efficient. Your scheduling software should save you time rather than bogging you down with repetitive manual data entry.
Project Templates
If your team regularly tackles projects with similar tasks, workflows, and requirements, creating project templates are an essential time-saver. Instead of building every new schedule from scratch, you can instantly load your standard project structure and immediately start allocating resources.
Automatic reporting
Compiling weekly or monthly project wrap-ups manually drains valuable management time. The right scheduling software eliminates this administrative burden through automated reporting. Look for a tool that allows you to track key metrics like resource utilization, project status, and budgets on a recurring schedule. You can route these automated reports directly to your inbox or straight to your stakeholders, removing a tedious step from your regular workflow.
Question #7: What’s your budget?

When considering your budget, there’s 3 basic choices.
- Free Gantt charts templates
- Freemium Gantt chart software
- Gantt chart SaaS
Free Gantt charts templates
Many teams start by forcing existing tools like Google Calendar or free Excel templates into a Gantt chart format. While these manual workarounds seem cost-effective initially, relying on static spreadsheets for complex project planning introduces expensive risks.
Without dedicated resource utilization features, managers frequently overbook team members, miss concurrent tasks, and derail long-term capacity plans. Ultimately, the operational costs and project delays caused by scheduling errors quickly outweigh the perceived savings of a free template.
Freemium Gantt chart software
Many dedicated scheduling tools offer a free tier, though these plans typically come with strict operational limits. You will often encounter caps on the number of users, restrictions on active projects, or paywalls blocking essential management features.
When evaluating an entry-level option, look for a pricing model that does not penalize collaboration. Ganttic uses a flexible, resource-based pricing system where your cost scales only by the number of resources you actually plan. Every tier provides unlimited users and full access to all features. The free plan caps your active resources at ten, allowing you to manage a smaller operation or thoroughly test the software without hitting arbitrary paywalls just to share your schedule.
Gantt chart SaaS
Investing in a dedicated Gantt chart tool is the logical next step for growing teams, though it should not inflate your operational budget. Many platforms bundle complex, unnecessary features simply to justify a high subscription cost. Before committing to a bloated system, carefully identify the exact scheduling capabilities your team requires.
Most software providers offer a free trial. Take advantage of this period to test the interface with your actual data and ensure the platform genuinely supports your workflow before making a financial commitment.