Estimated reading time: 9 minutes
Overview
For 13 years, Finland’s Port of Hanko has chosen Ganttic to visually manage over 1,200 vessels annually. Despite the rise of niche maritime software, the team prefers Ganttic for its visual clarity and drag-and-drop simplicity. By leveraging flexible features like custom color-coding, Task Dependencies to easily manage delay domino effects, and a mobile app for dockside updates, Ganttic perfectly adapts to their specific workflow, proving that an easy-to-use, highly customizable visual tool is the ultimate anchor for their complex logistics.
Our partnership with the Port of Hanko is one of our longest-running collaborations, spanning 13 years of continuous growth. Since 2013, this vital maritime hub has traded static spreadsheets for Ganttic’s real-time visual clarity. As they navigate the complexities of modern European shipping, Ganttic remains the primary engine for their daily operations, serving as their capacity planning software.
Recently, we traveled to the southernmost tip of Finland to visit the team in person and enjoy the stunning sea view in Hanko.
Located roughly 120 kilometers west of Helsinki, Hanko serves as a critical maritime artery connecting Finland to continental Europe and the broader international market.
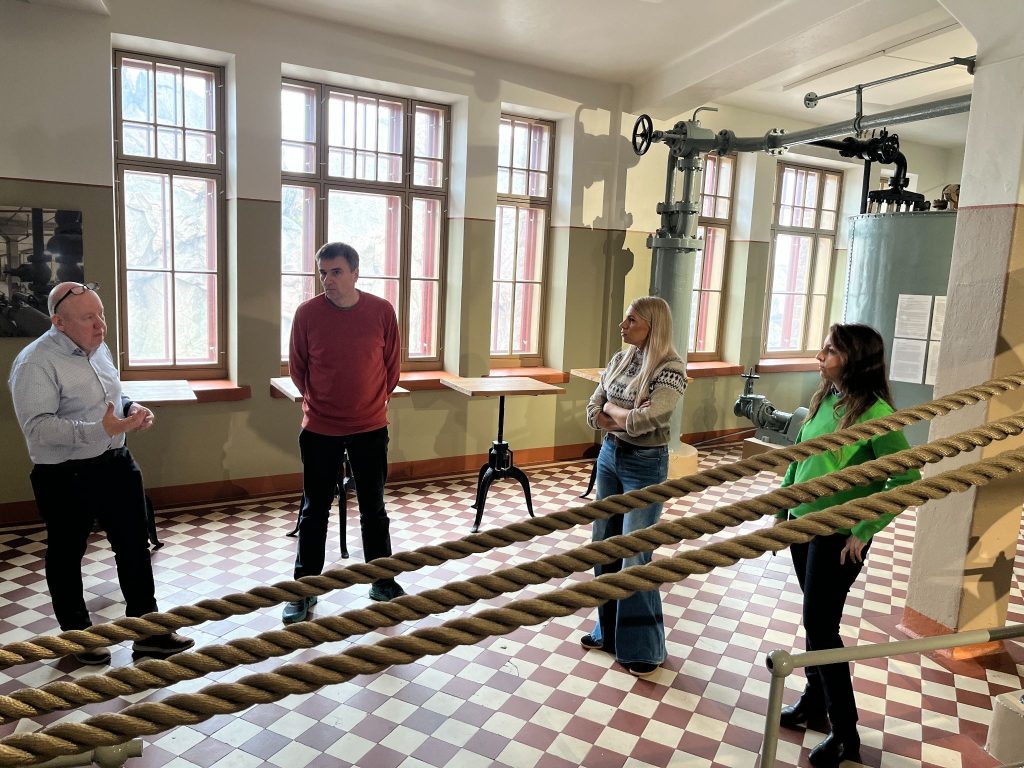
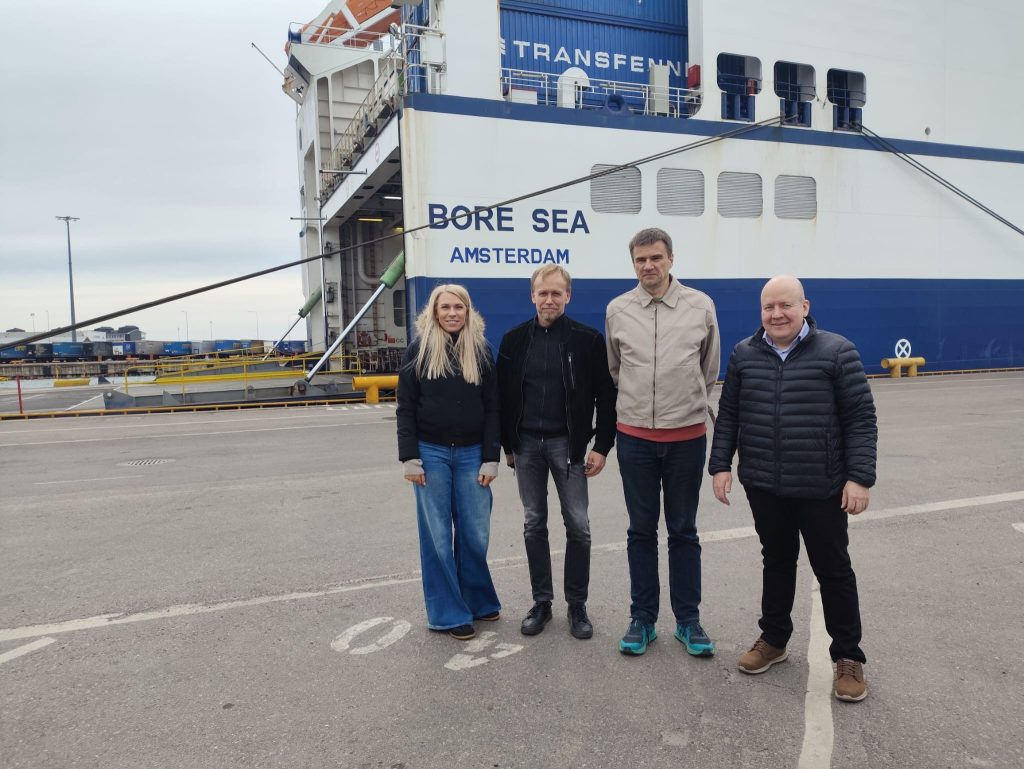 From left: Merlin Griffin, Customer Experience Specialist, Ganttic; Ivar Veenpere, Co-founder of Ganttic; Rainer Kivimaa, CO-founder & CTO, Ganttic; Timo Sjösten, COO/CIO, Port of Hanko
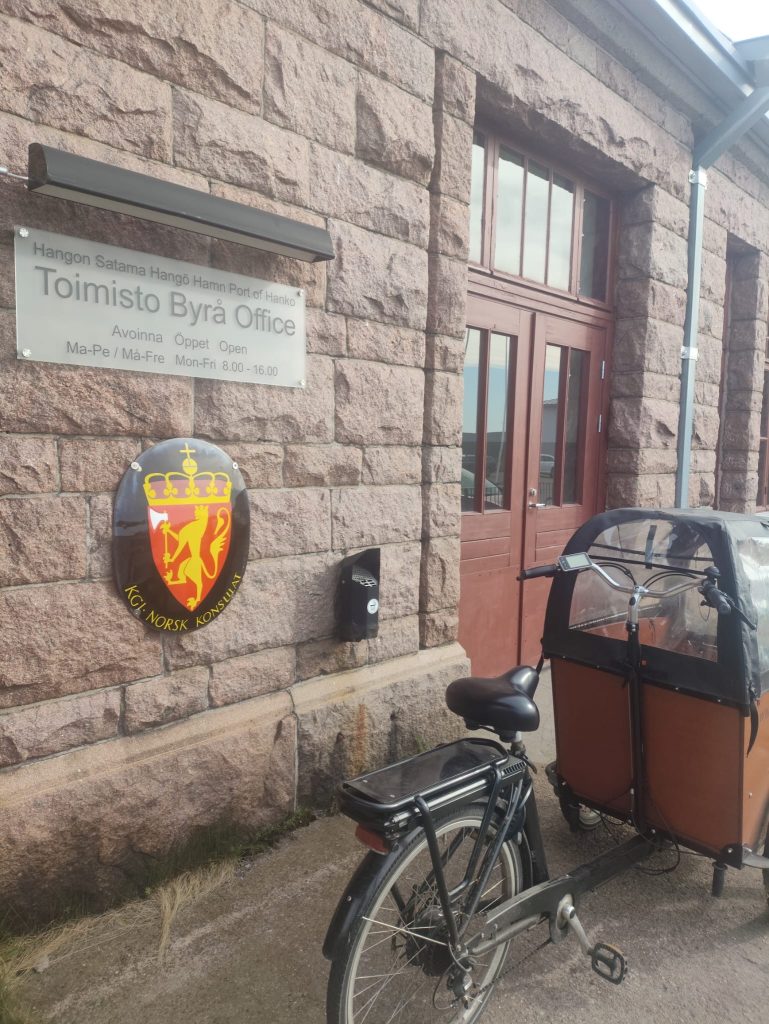
We sat down with Timo Sjösten (COO/CIO) and Anders Henriksson (Project Engineer) in their historic office, with a stunning sea view. The building dates back to the beginning of the 20th century and once served as a warehouse for exporting Finnish butter, a fitting backdrop for a conversation about modern logistics.
About the Port of Hanko
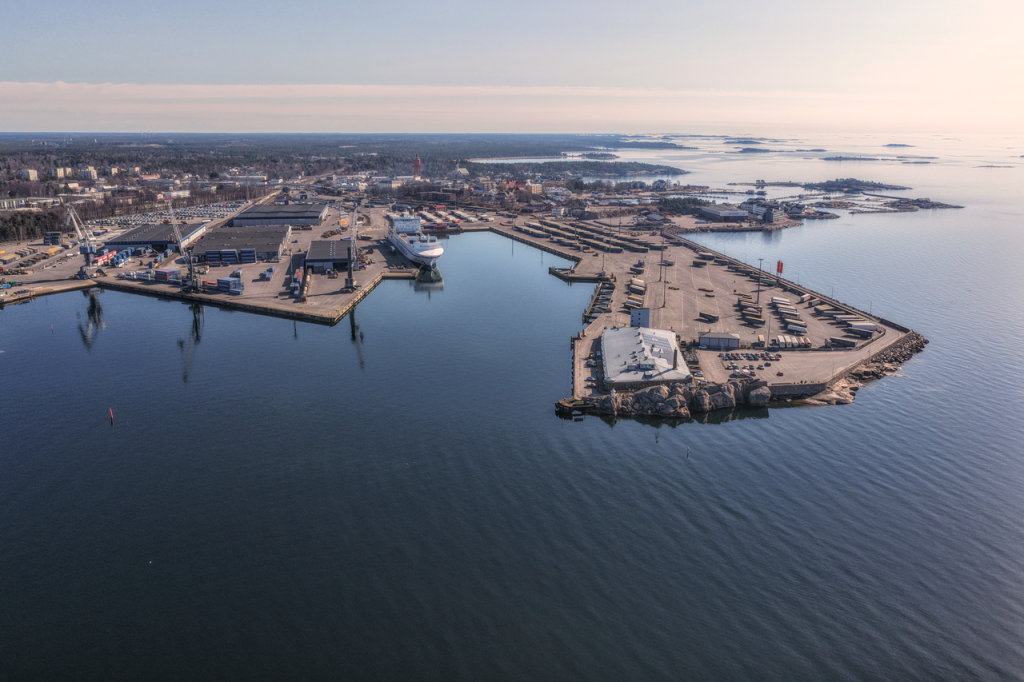
Located at Finland’s southernmost point, the Port of Hanko is a frequent stop for shipping routes connecting Scandinavia, the Baltics, and Continental Europe.
In 2025, the port handled 5.2 million tons of cargo and over 1,200 vessels. To accommodate larger modern ships, the port is currently expanding its infrastructure with new berths.
Problem: from Excel printouts to visual clarity
When Timo first started at the port, he found a team heavily reliant on manual processes to manage their massive daily throughput. The old-school method involved complex Excel spreadsheets that were difficult to update and even harder to share.
“We were doing our allocations on Excel, planning for the next week, and literally printing out the sheets,” Timo recalls. “I understood then that we really needed a visual tool to see the changes and work together effectively.”
Solution: resource and task visualization with Ganttic
Timo discovered Ganttic through a Google search and was immediately drawn to the platform’s visual interface, easy-to-use features, and the clarity it provides. After a brief trial, he decided it was time to make the switch.
The transition to Ganttic was about more than just sailing away from a sea of spreadsheets; it was about capturing the big picture as clearly as possible, giving the entire team a single, shared view of port operations.
The operations team started with Resources. The second step was to create Tasks and assign them accordingly.
As with many industries, maritime logistics brought its own terminology, which Ganttic easily accommodates. In the Port of Hanko’s operations, the Resources are not people; they are berths. The Tasks are the vessels themselves.
Sign up for a free trial with all the features included, plus the option to book a demo for additional support. No credit card required!
“It’s easy to share across the team, and the combination of custom Data Fields and visual clarity is exactly what we were looking for.”
The Port of Hanko’s journey with Ganttic highlights one of the core strengths: its ability to mold itself to the user’s specific logic. Reflecting on their early days with the platform, Timo notes that their implementation was unique.
“In addition to what it was meant to be, at first we used it in many different ways!” he says.
This unconventional start makes perfect sense within the Ganttic ecosystem. Our tool is designed to be highly flexible and customizable from its online gantt charts to custom Data Fields, meaning there is no single right way to use it.
Every team builds their own version of Ganttic that adapts to their specific workflow needs, and for the Port of Hanko, that meant pushing the boundaries of the Gantt view from day one.
From the Port of Hanko office, Finland
As technology progressed, so did their setup, with the Ganttic API
“During the pandemic, while the world was in lockdown, Anders worked remotely with our developers to build a custom integration via the Ganttic API using Frends as well,” explains Timo.
 Timo Sjösten and the Ganttic team
Today, the port uses a custom-built portal and machine learning algorithms to calculate the Estimated Time of Arrival (ETA) for vessels. Through Ganttic’s open API, data from different systems can flow directly into the Planner and become part of a single, clear visual schedule.
Each incoming record is pushed in, automatically created as a new task in Ganttic, and kept in sync as the source data changes. When the port adds a new vessel and its details to their system, the information automatically appears as a visual task on the Ganttic Planner.
“We pull weather data and traffic info directly into the system using the API,” says Anders. “The goal is to share relevant information through our common portal, keeping everyone in the loop. It’s been very easy with Ganttic so far.”
Timo and his team also use the Ganttic Mobile Planner, which allows them to stay updated on the move: Whether they are coordinating a vessel’s arrival at the quay or managing resources directly from the docks, the app ensures that real-time shifts in maritime traffic are reflected instantly. This gives the team a live operational overview right in their pockets, allowing them to adjust to changing weather or arrival times without heading back to the office.
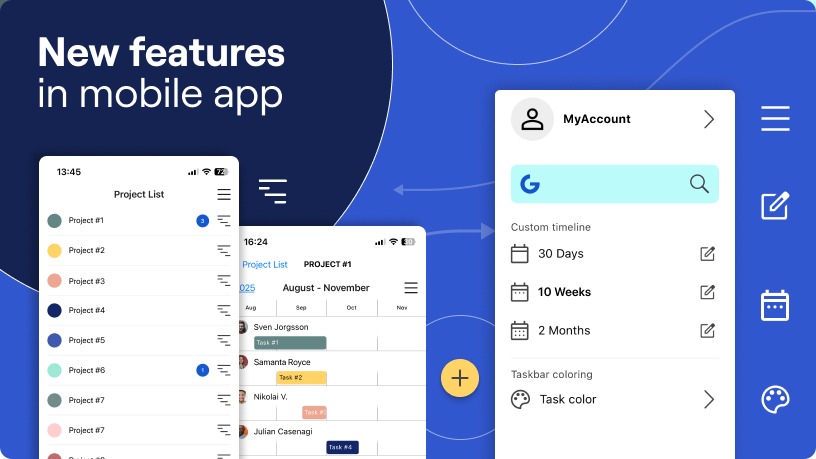 The new Ganttic Mobile App was released in November 2025
What makes Ganttic still the first choice after 13 years
Despite other port-specific solutions entering the market in 2017, the team at Hanko prefers Ganttic. For them, the decision comes down to the simplicity of the user experience, customization, and the power of visualization.
“The simplicity of the drag-and-drop interface provides immediate clarity. Entering a vessel as the task, and seeing it appear automatically on the schedule, is what makes the system work for us.”
Top features: The Port of Hanko Team’s favorites
“The history feature is very useful and works well with us. Also, being able to jump between a 2-day view for immediate operations and then quickly going back to the previous view is a great feature.”
During our visit, the team highlighted several specific Ganttic features that have become indispensable to their daily operations:
- Notes: The Port of Hanko team utilizes the integrated Notes function to add specific notes and real-time updates to their Tasks. This makes it easy to share critical information across the team, keeping everyone in the loop.
Find out more about Kanban boards, Notes, and Time Tracking and how they can also be used for Resources and Projects.
- Task Dependencies: A standout favorite, the team relies on task dependencies to manage the domino effect of port logistics. It allows them to see exactly how a delay in one vessel’s departure will ripple through the schedule for the next docking.
Dependencies are the relationships among Tasks which determine the order that activities need to be performed. Read more here: Task Dependencies
- History and Views: Timo specifically praised the ability to track changes and pivot between different time scales.
- User Permissions: To maintain security and privacy, the team uses permissions to hide sensitive information from specific users while ensuring every stakeholder has the data they need.
- Color Codes: In their own words, the team “absolutely loves” the color-coding system, noting that it makes the entire schedule significantly easier to track, analyze, and digest at a single glance.
Ganttic and the Port of Hanko: 13 years and more to come
For Timo and Anders, Ganttic is a great visualizer that has scaled with them from the era of paper printouts to a modern, data-driven operation. Even as other port-specific solutions have entered the market, the simplicity of the Ganttic interface remains their primary reason for staying.
The sentiment was all any team could wish to hear from their client:
“Ganttic works very well for us. We are very happy.”
FAQ
They use it for visual capacity planning to manage operations for over 1,200 vessels annually. By treating port berths as Resources and incoming vessels as Tasks, they successfully replaced static spreadsheets with a dynamic, real-time schedule.
Key features include Task Dependencies, custom color-coding for rapid visual analysis, notes for sharing specific information, and a mobile app that allows the team to adjust schedules from wherever they are.
Through Ganttic’s open API and a custom integration built with Frends, data from external maritime systems is pushed directly into the Planner. This automated data flow ensures live vessel ETAs, weather conditions, and traffic updates appear on the Ganttic schedule.
Maritime operations teams prefer Ganttic because of its intuitive design and highly customizable interface. It empowers them to build scheduling systems tailored to their exact workflows rather than forcing them to adapt to rigid industry templates.