Enthusiasm is great. But a truly winning formula couples unbridled enthusiasm with a plan of action. And that’s where visual planning comes in. That’s because, as knowledgeable or as passionate as you may be about your industry, you can’t expect to see success if you’re flying blind. Until you come up with a plan, you and your employees will never be on the same page.
What is Visual Planning?
Visual planning is a way to develop a strategy for your business. Whether it’s a plan for a new product, for a special project, or for the way your company operates as a whole. Think of the idea as a roadmap for your organization or project. After all, unless everyone knows what the end goal is, you won’t be able to work efficiently to get there!
Types of Visual Planning
In order to plot your course you need a map. Similarly, if you wish for your organization to meet its goal, you need to lay out a plan for your projects. And depending on your preferred approach and project management methodology, there’s plenty of options available. Here’s a few tools to get you started. From simple to more complex.
- Calendars – A super basic, but simple way to lay out the timeframes of projects and tasks. Pinpoint start and end dates, potential scheduling conflicts, as well as project timespans.
- Spreadsheets – A workplace mainstay for almost 40 years. Spreadsheets are nice because they contain hard data, but they can be manipulated to be used in whatever way works for you. Stretch those columns. Scrunch those rows. Color it as you like. Or slap on a template. Spreadsheets have their limits, but are a great way to launch into visual planning.
- Whiteboards – Another ubiquitous office tool, that’s great for storyboarding, mind-mapping, and spit-balling new ideas. In the age of remote work and distributed workforces, whiteboards aren’t as widely utilized, but still important for the early stages of project planning and in-office collaboration.
- Gantt charts – Horizontal bar charts that depict on-going, forecasted, and completed projects. Gantt charts are set against a timeline or calendar so you can clearly see start dates, milestones, and deadlines. Some Gantt chart software also showcases the projects’ resources, so you can spot who’s working on what.
- Kanban boards – A visual planning board made up of either literal or virtual sticky notes which portray a project’s status. Each project or task is separated into status columns called swim lanes. These are then moved around your Kanban board accordingly, depending on completion, if they’re delayed, or put on the back burner for the time being.
Benefits of Visual Planning
What makes this approach to project planning so great? Here’s a few reasons why you might want to give visual planning software a try.
Easy to spot goals
Just as the easiest way to finish a maze is by starting at the end, with everything in business, you have to start with a goal in mind. Then you can decide the best course of action. With visual planning software, you’re better able to see both the short-term and the long-term. Helping you plan not only for tomorrow, but when crises arise in the moment as well
It’s more comfortable for users
More than half of the population are visual learners. So what better way to help them keep to a schedule? By being able to check in quickly on their phones or desktops, then they can see what exactly they need to be doing, without any extra explanation on the PM’s part.
Keeps teams on the same page
Thanks to visual planning software, you can keep everyone on the same page, without having to hold a bunch of meetings or waste a ton of time. Instead, everyone can have the details of the plan right on their computer screens.

Simply easier
Lastly, the best reason to go this route is their simplicity. There’s transparency and accountability every step of the way. Plus, when it comes time to reschedule something, change something, or evaluate something, everyone will be able to see it. Plus, everyone will be able to see what everyone else is responsible for. It’s like getting a bird’s eye view of the entire project!
Why Use Visual Planners?
Visual planners offers several benefits that make it an essential tool for businesses and organizations:
Enhanced clarity
Visual representations of data, tasks, and timelines provide a better understanding of complex information. That’s because instead of a huge data dump, you see data in action. This helps teams and stakeholders grasp key concepts more easily. Leading to improved communication and decision-making.
For example, say you want to document all your employees skill sets and use them to make smarter schedules. While it’s possible to use a skills matrix you create in Excel, with a visual planner, there’s no pivoting or toggling between sheets. When creating a schedule and you have a task that requires a specific skill set, just filter down the information you have to see who would be the best fit.
Better communication and collaboration
Visual planners promote collaboration by allowing team members to work together in real-time, regardless of their location. Instead of relying solely on text-based documents, email, or verbal explanations, teams can use visual tools to convey ideas, plans, and progress more effectively. Collaborative features such as commenting, real-time updates, and report sharing facilitate communication and ensure that everyone is on the same page.
Plus, it provides a shared visual language that everyone can understand. With visual planning software you can instantly see how much of a task has progressed as well as what tasks are dependent upon their completion. In Ganttic for example, when a part of a task is finished, the color on the task bar changes. So you can spot how far along each task is with just a quick glance. Dependencies highlight which tasks are connected, so you never lose track of progress.
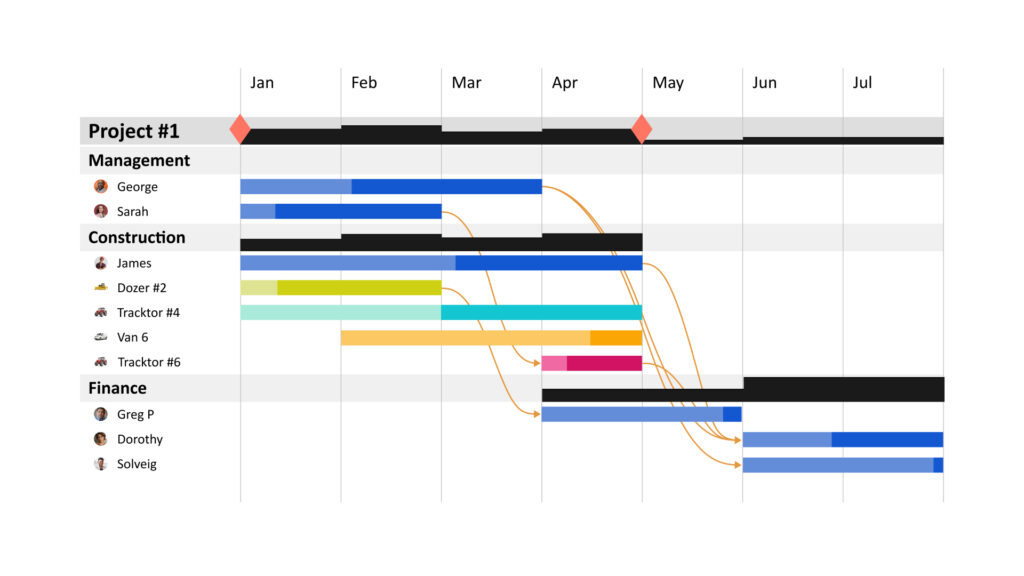 An example of visual planning in Ganttic. Here, the task bar colors correspond with task progression.
More adaptability and flexibility
Visual planners are often highly customizable, allowing teams to tailor it to their specific needs and workflows. This adaptability makes it suitable for a wide range of industries and project types, from software development to construction to marketing campaigns.
Easier resource optimization
With visual planning, teams can allocate resources more effectively by providing a visual overview of resource availability and utilization. This helps prevent overallocation, minimize bottlenecks, and ensure that resources are allocated where they are needed most.
Increased productivity
Visual planning software streamlines project management processes, saving time and reducing manual effort. Features such as drag-and-drop functionality, automated scheduling, and task dependencies help teams work more efficiently and effectively.
And this benefits decision makers too. That’s because it presents information in a visual format that is easy to analyze and interpret. Allowing decision-makers to quickly identify trends, patterns, and insights. Leading to more informed and timely decisions.
Visual Resource Planning with Ganttic
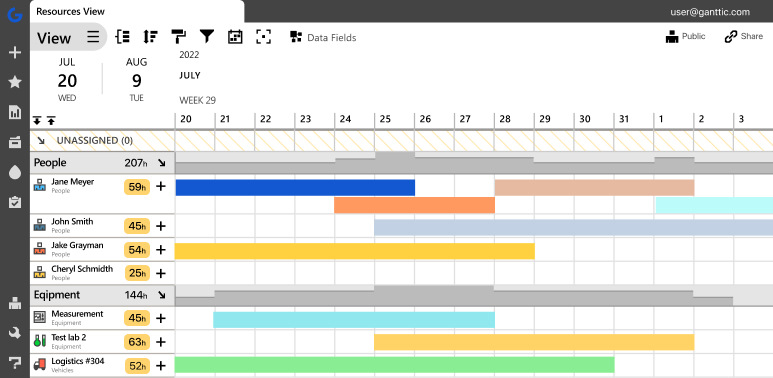 Ganttic is online software for visual resource planning.
Luckily, visual planning isn’t tough to do. In fact, here at Ganttic, we designed our software to be as user-friendly as possible. An online Gantt chart, with things like color-coding and drag and drop scheduling. That way, you spend less time fiddling with the software and more time working towards your goals…the way it should be!
Sign up for a free demo to see how Ganttic will fit into your own workflow. And discover a more efficient way to reach those goals.