Gantt charts are the preferred way for project managers to view their data.
Yet it can be frustrating that they don’t come standard on tools like Excel. And to use this method of project planning, users must create the Gantt chart themselves.
Luckily this process is relatively straightforward. Here we’ll give you an easy, step-by-step tutorial on how to make a Gantt Chart in Microsoft Excel. And how doing so will improve your project planning.
What is a Gantt chart?
Gantt charts are horizontal bar charts which have been around for at least 100 years. Credited to Henry Gantt, these handy charts have been a mainstay for PMOs. Which is mostly due to their ease of creation, visuality, and customizability.
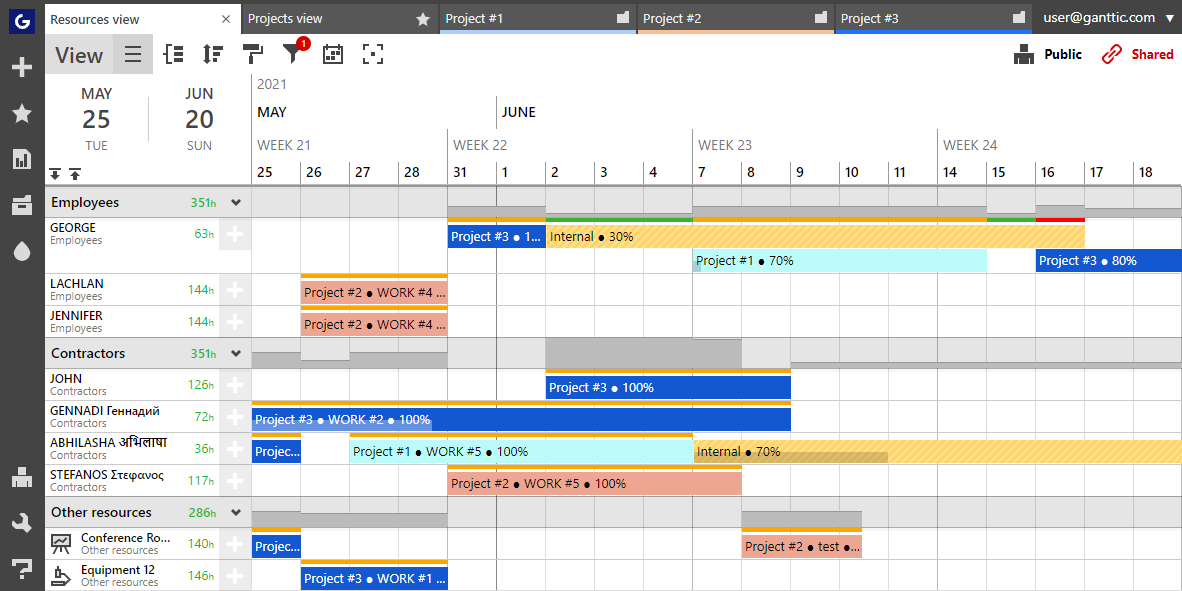
The main features of Gantt charts include:
Timeline – shows how your activities (projects and tasks) are progressing. As well as which resources are utilized in the process.
Bars – a visual representation of your projects and tasks. Demonstrating not only the length of time, but also as a way to see who or what is engaged in that task.
Resources – the people, machines, and equipment which bring projects to fruition. Assign resources to tasks and see who’s engaged in what, who’s in need of some helping, and who can pick up some extra work.
Dependencies – the links between a project’s tasks. Not only can you see the associated tasks of a project, but how these tasks are linked together. And what order something needs to be done for the next one to start.
Why Use Gantt Charts for Project Planning?

Gantt charts are useful because they are visual, flexible, and convenient. Once you begin planning with them, you’ll notice the following benefits:
1. Visual overview of projects, tasks, and resources
From the who’s to the what’s and when’s. Gantt charts give you a rundown of all your project and work-related activities. With just a glance you’ll know who’s busy, project duration, and task dependencies. Which considering the visual nature of humans, makes it a lot simpler to plan. As well as making it easier to schedule and track your remote and dispersed teams.
2. Accommodates all types of planning
What’s your preferred project management methodology? Agile? Waterfall? A mix? However you choose to plan, be assured that Gantt charts can accommodate the way you plan. Not to mention what you plan.
Because of their flexibility they’re also super useful for any kind of industry. From design, to engineering, mining, construction, and more.
The fact that they’re industry and methodology agnostic means they are the perfect compromise for PMOs. Because project managers in different departments can use one tool and one resource pool. Making it easier to track shared resources and multi-project planning.
Gantt charts can also be used in addition to other planning tools. For example, pair them with Kanban boards to get a new handle on the way you view projects.
3. Easy forecasting and planning
Online Gantt charts are a simple solution for even the most complex data. And that’s one reason why they work so well for long-term planning. Quickly view timelines and get a handle on future capacity and project deadlines. Plus check whether you’ll hit those milestones.
Because they are so apt with future prediction, you can use the charts to fix problems before they start. Smooth out bottlenecks, add help to understaffed projects, and fix those overutilizations. Plus, more precisely plan out project phases with dependencies.
It’s no wonder that Gantt charts are loved by PMs and project leaders worldwide.
Choosing the right Gantt chart for your project planning
Nowadays there are many Gantt chart creators to choose from. While some are cloud-based SaaS, you can also find local software. Whatever the needs of your project, company, or budget, there’s an option available for you. You can even create a Gantt chart in Google Calendar if that fits your planning style better.
To find which works best, start by asking yourself a few questions. What kind of planning will you be doing – project or resource based? Is sharing with the team necessary? Do you need customization options? These can get you a step closer to finding the right Gantt chart maker.
But maybe you just want to start with the basics. And a Gantt chart template in Excel is a good place for that. So let’s look at how to create a chart in one of the most ubiquitous office programs.
How to make a Gantt Chart Template in Microsoft Excel (for free)
If you want to harness the power of Gantt charts but are used to project planning in Excel, you’re in luck.
Although Excel doesn’t have a built-in Gantt Chart template available, with some formatting, it is easy to create one. Just follow this step-by-step guide:
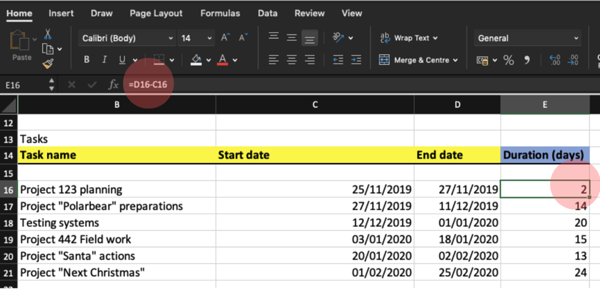
1. Enter your data on the Excel field and create a table for the project.
 Start with your project Task dates and info.
First start with your project and task data. This will be the basis of your Gantt chart. Some example field names might be:
- Task name
- Day the task starts or Task Start Date;
- Days left until completion or Task Duration
TIP: You can calculate Task Duration with the help of Excel by adding the Task End date. Use the “days” function ( =DAYS(end-datestart-date) ) – just make sure you have dates formatted as dates.
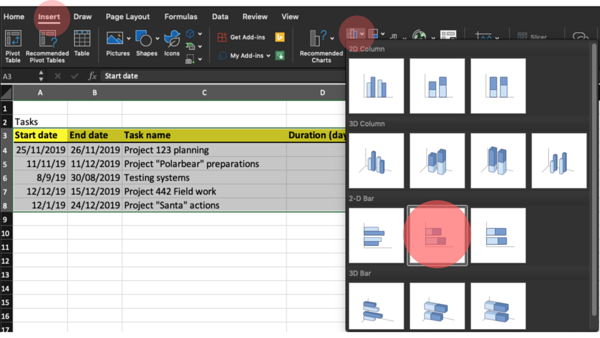
Then choose “Stacked Bar” from the 2D Bar Chart section.
Alternatively, you can start by creating a graph first. And then populating it with your data from the first step. Whatever helps you plan better!
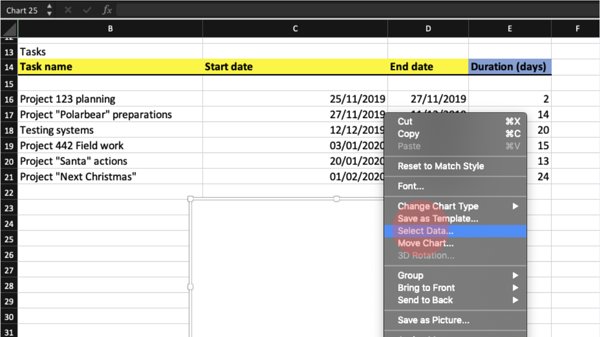
Choose: “Select Data…”. This is where we’ll start adding data to the graph. Transforming the usual “Stacked Bar” into a Gantt chart.
4. Add “Start Date” & “Duration” in “Select Data Source” window.
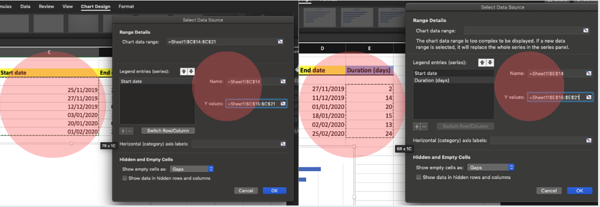
- Choose the little “+”as series/legend entry;
- Choose “Start date” column as the Name, real start-dates as the Y values;
- Add another series with “+”. Choose “Duration” column as the Name,”duration values” as the Y values;
- Add Task Names (excluding the header) as the Horizontal (category) axis label.
At this point, your Stacked Bar Chart will still look a little off from a Gantt chart. Don’t worry! We just need to format it a bit.
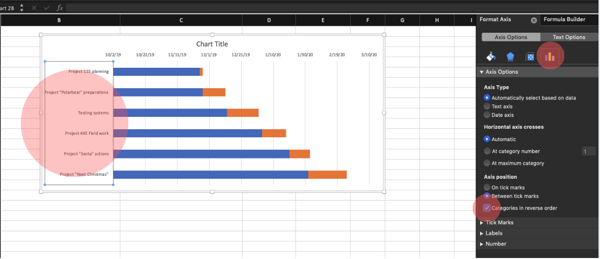
First, reverse the data by selecting the tasks and choosing “Axis Options” from the right menu that appeared. Simply choose “categories in reverse order”. This way our dates and data are in the correct order for the Gantt Chart.
6. Getting the Gantt Chart template to begin from the right starting point (the earliest task start date)
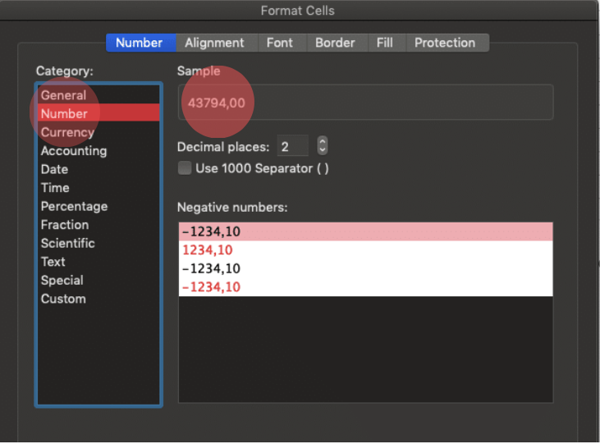
- Right-click on the earliest “starting-time” column in the table and choose “Format Cells.” See the column category in NUMBER value. Remember or copy it!
- Use that number to format the graphs date-line axes in the same way. Click on the existing chart dateline and simply change the starting number shown from the right-hand menu.
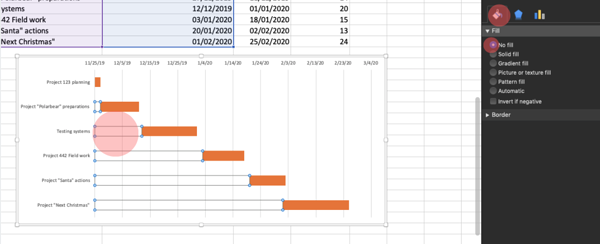
7. Go “No Fill.”
We are getting there! Time to activate the left axes series on a graph (Start date section) and choose their Fill from the right menu to “No Fill”.
This move makes half of the previous graphical info in the data series transparent.
8. The Gantt chart template is complete. Plan, share, and succeed.
You should now have a Gantt chart that would get Henry Gantt’s seal of approval. Feel free to customize it with your favorite color or one from your company’s brand book. It’s also up to you whether to keep the chart legend, or delete it. Personally, we recommend deleting it.
You can also save this as a template. Making it easier for the next time.
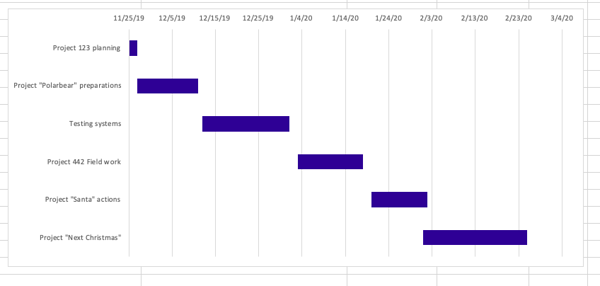 Simple Gantt chart made in Excel.
Customize Your Gantt Chart Template

Now you can see your project and action flow way better! If you’re working with a lot of data, some extra info might be helpful to get everything under control. Or maybe you have a color which you prefer to the default options? This is all possible by using the Chart Design tab.
From Chart Design tab menu you can:
- add some additions to your Gantt Chart;
- change the general layout and design options.
To make your life easier and create a new chart more quickly next time, you can even save your chart as a Gantt Chart Template.
That way you can reuse the chart the next time you need to create a graph. Gantt chart templates make the process easier, project by project. I assure you!
Free and paid Excel Gantt chart templates
Maybe you tried out your own Excel Gantt Chart, but it’s still not what you had in mind?
No worries. It’s likely someone else had the same problem. And while projects and needs are usually very different, you can usually find something that fits your requirements. In fact, there are a number of Free Excel Gantt Chart templates available. Or there’s some other ideas here. As well as some paid versions to help you get started. These can make the process go more smoothly.
But maybe it’s still not enough? Because it’s possible you’ll run into some other problems down the road.
Disadvantages of using an Excel-based Gantt chart template
Creating a Gantt chart template in Excel isn’t that difficult. And within a few minutes, anyone with a cursory knowledge of spreadsheets can create a working design.
But be aware of the downsides of using your Excel-based Gantt chart. Because there are a few issues that may come up. And which may hinder your planning process.
These disadvantages include:
1. Time-consuming
Not necessarily the process of creating the Gantt chart. But as we’re sure you’re aware of, Excel isn’t the easiest program to deal with.
And if you end up missing a few tasks in the process, or you accidentally skip a step, it’s sometimes preferable to just start from scratch. As frustrating as that may sound.
It’s not only the planning process which can be time-consuming. Sharing your newly made plans with the team can be a real timesuck. Emailing out the latest version. Plus ensuring that your team actually SEES the plans will (unfortunately) eat away several hours of the week.
2. Hassle to make changes
The problem with the Excel Gantt chart template is that it’s based on your data. But what if your data is incorrect?
Maybe a task needs to be moved. Or maybe the predictions are off. Or what if the resources are overbooked? Either you’re forced to spend precious time wrestling with the changes, or you start over.
And since it’s obvious that plans are not set in stone, there will inevitably be changes. So hopefully you’ve set aside a few hours in your planning schedule to deal with making these changes.
Read on: If you’re interested in some other ways to plan your projects without the headache of spreadsheets, have a look at our 10 alternatives to Excel.
3. Easy to make costly mistakes
Not known as the most intuitive program out there, Excel can easily do one thing. Though it’s probably not something you’re looking for when it comes to project planning. But it is pretty easy to make a mistake. And unfortunately, this can be costly to your projects and company.
Overbookings. Overutilizations. Inaccurate projections. This is all part and parcel of project management. But Excel doesn’t provide the correct tools to help alleviate these issues. Meaning mistakes are more likely to happen. And as PM, you’ll be the one to deal with them.
Read on: Mistakes can happen at any point of the planning process. And the best way to counter them is to be prepared. When doing project management, don’t skimp on the resource planning stage. See where a resource Gantt chart can come in handy for this workflow.
4. Incompatible with the modern way of working
Excel was created almost 30 years ago. And a lot has changed since then. The past few years has seen a rise in remote work. In addition to offices preparing for new hybrid setups for their employees.
With all these changes, it’s strange to rely on such an ancient system. This is glaringly obvious when you work on a virtual team, because there’s so much you can’t do with Excel.
Manually sharing, licensing issues, security concerns, these are all everyday problems for PMs when they use Excel. Adding to that is the high costs associated with the program. Something which isn’t always in the budget for large teams looking to stay lean.
Excel Project Management and the sunk-cost fallacy
Many companies depend upon Excel for the project and resource management because it’s something they already have available. If you’re paying for the Office license, why not just use Excel for your project planning as well? It beats paying for another service, right?
Excel is an example of throwing “bad after good.”
Instead of investing in a more suitable (and a more cost effective tool) companies continue to throw more money at Microsoft. It’s likely that your Development team or your field workers won’t need an Office license. But without paying for one, how will they view their plans?
This adds up.
With prices starting at 8.25 per user, per month, your overhead can easily skyrocket if you want everyone to stay in the loop of the project plans. And this doesn’t even take into account the cost of errors incurred in the planning process. Or the time wasted on reformatting cells.
That’s why in the long run it’s smarter and easier to replace Excel with proper Gantt chart planning software.
Ganttic for easier Gantt chart planning
You don’t have to let the sunk-cost fallacy sink your plans. Ganttic resource planning software is priced per resource, not per user. Meaning you can have an unlimited number of users create, view, and access your plans. This is more scalable for startups and SMBs, who can grow their resource pools as they grow as companies.
See what it’s like to throw money after good for a change.
We help to keep your project and resources under control. And you can focus on what is important. Contact us for a free demo if you have any questions.