A Gantt chart maker is the secret weapon of busy project managers. With just a few clicks, you can get your project planning and resource management squared away for the week, month, or even year!
Simple to learn and easy to use, the only difficulty is finding one that works for you. This article can help with that, though. We’ll give you the questions you need to ask in order to choose the right tool for making Gantt charts just for you. Only by asking the right questions can you get the right answer.
Benefits of Gantt Chart Makers
Online Gantt charts are not only super versatile, but they make the job of managers, project planners, and schedulers considerably easier. With a visual cue of dates, deadlines, and bookings, both management and teams can see at a glance what’s happening now. As well as what’s to come.
Here’s a few more reasons to consider planning and scheduling with a Gantt chart.
- Visual and clear– people are inherently visual learners. And are able to retain information faster and longer when data is made into graphs, charts, and infographics. Gantt charts visualize complex data. Breaking down tough concepts into actionable snippets.
- Transparent – in a world of remote and hybrid work, it’s important to know what your team is working on. Even if you aren’t in the same room.
- Timesaver – Gantt charts illustrate to your team what needs to be done. Without you telling them. And as opposed to messy spreadsheets and timetables that need to be emailed out after each correction and update.
- Flexible – early charts were used for engineering. But since then, everything from military operations, to software, to even the Hoover dam has been planned via Gantt’s creation. Not only are they versatile for every industry, but they can be adapted to any management methodology. Even combined with other tools. For example, Kanban boards go great with Gantt charts.
How to Choose the Right Gantt Chart Maker?

There’s plenty of great software which makes Gantt charts. Each with their own unique features and specialties. If you’re in need of finding a new tool that fits your workflow, there’s a few questions you should be asking.
Here’s a few considerations to keep in mind.
Question #1: Are you planning resources or managing projects? Or both?
There are 2 basic kinds of Gantt chart makers.
- Ones that focus on planning and scheduling resources.
- Those that center on managing projects.
- Gantt charts that focus on project and resources.
The best Gantt chart maker for you depends on your needs. Do you want to zero-in on resource planning? Or is project management more important?
Figure out what kind of planning you intend to do with your chart and let it take over from there!
Gantt charts for resource planning
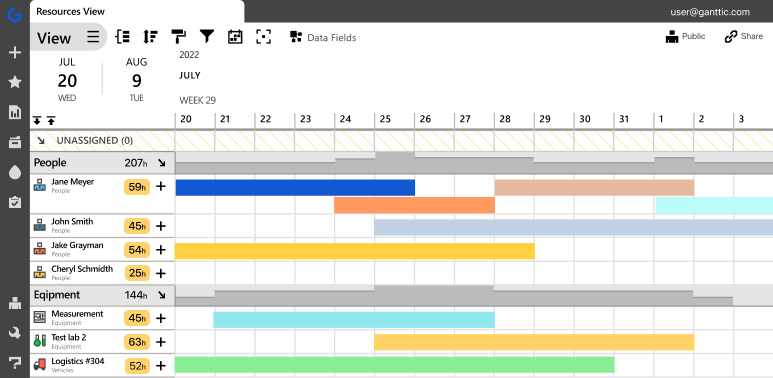
Software which concentrates on resource planning is great if you only need them for simple resource scheduling. The same goes for those who are looking for a way to plan and book tasks for the people, tools, equipment in one organized location.
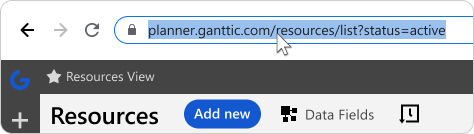
When on the hunt for resource-based Gantt charts, look out for features such as drag and drop scheduling, utilization tracking, and adjustable permissions.
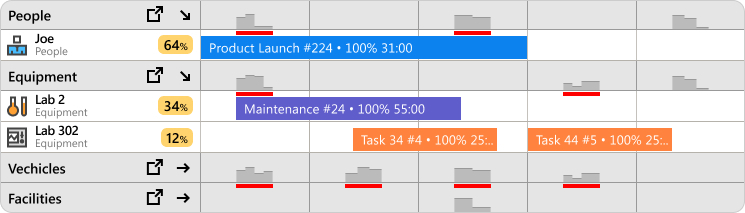 In Ganttic, you can get utilization metrics for individual resources and groups.
Gantt charts for project management
Perhaps project planning is your forte. In this case, you need to be able to schedule projects according to your timeline. As well as the dependencies, tasks, and resources associated with the project.
But once you get to a higher level of planning, you may need to seek out specific project planning Gantt charts. Dynamic timelines, project grouping, and project data fields are all important features to be a successful project manager. And can help juggle multiple projects at once.
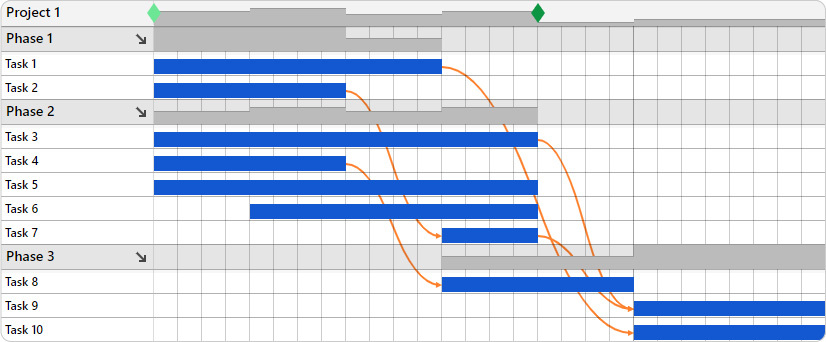 Track your project phases with visual dependencies.
Gantt charts that focus on project and resources
Even better than choosing between resource planning and project portfolio management is when you find smart software that can do both!
Specialized matrix planning tools allow users to go back and forth between resource-based and project-based charts. Create a View of resources and one of projects. This helps provide a more comprehensive picture of both your projects and the resources assigned to them.
This kind of Gantt chart feature is truly flexible for how different project managers plan. Book resources for projects and tasks. Or start from the projects’ POV – add deadlines, dates, and unassigned tasks. Then resource it later.
This is not only a more comfortable way to plan. But it ensures that nothing is overbooked or overlooked in the process. Learn more about a matrix planning approach to Gantt charts.
Question #2: What are your collaborative and sharing needs?
Most software for making Gantt charts offer a chance to collaborate in some way. But keep in mind what you’ll actually be using them for. And remember that one-size-fits-all solutions often fail to deliver.
Are you sharing files? Do you need to chat while planning? Do you need to brainstorm in the application? Are simple notes and comments enough? For some, it might be overwhelming to deal with additional features you might not even use. And can add to a steep learning curve when adopting the tool.
Perhaps you need software that lets everyone on your team partake in the planning process. Or maybe there’s one project manager calling all the shots. Either way, it’s likely you’ll need to be able to share the plan or schedule with the rest of your team.
In that case, be on the lookout for Gantt chart makers which allow unlimited users. That way, your plans aren’t dependent on who has a software license.
And an even better approach is if you can share the chart with non-users. This is super convenient if you need to share plans with a client or third-party. Sometimes a simple URL can say it all!
 In Ganttic, you can easily share your Gantt charts with users and non-users.
Question #3: Big picture planning or specific details?
Gantt charts breakdown complex info in a way you can easily absorb. But what kind of info does your chart need to contain?
When it comes to simple scheduling, you may only require the timeframe and the name of the booked resource. The project or task name can also come in handy sometimes.
In more strategic resource management, it can be useful to add extra details pertaining to your resources. Information concerning resource locations, skills, or hourly rates are common resource data fields. But depending on the nature of your business, other info might also come in handy. Time zones, languages, even uniform size are a few examples.
PPM also requires some specific information about different projects: start and end dates, client data, project manager names and contacts, and anything else you need to keep your projects on track. Not to mention
Think about the kind of planning you’ll be engaged in. And what sorts of details (or lack thereof) are necessary. The best compromise is finding a tool that lets you be as detailed as you need. No more, no less!
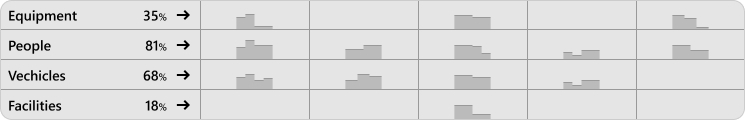 In Ganttic, you can create visual heatmaps of which resources are busiest across the portfolio.
Custom data fields are the data fields that can be customized. That’s helpful, ain’t it?! Well, in Gantt chart makers like Ganttic, you can add custom data fields to all elements on the project chart.
These fields are there to contain all sorts of information that you have. Information about your resources, projects, and tasks. Kinds of information that you can not add to a Gantt chart Excel template. Information that would have to be communicated using another method if there wasn’t Gantt chart software there to help.
Just imagine that you are using drag and drop scheduling to create a simple Gantt chart. You are choosing options from drop-down menus, adding the reference number and the note. Then you click save. Sounds a lot better than before, huh?
With Ganttic, you can create a customizable Gantt chart that simple to understand, but filled with complex data. No spreadsheets. No emails. No missing information.
Task Data
As we described earlier, you can add all sorts of additional data to a simple Gantt chart using custom data fields. The status, the project manager, the Google map of the worksite, and so on.
The best part is, all this information you have added can be filtered out or highlighted with specific coloring coding as it is with projects.
Resources

Resource custom data fields are the most used ones. If you are staffing projects, you can add the location where the resource is based, in addition to their certifications, driver’s license types, skills, position, or even hourly rate.
But with Ganttic, resources can be anything from people to equipment. So when you have tools or machinery you can also add in a reference number, or weight class, or necessary inspection dates. Nice, huh?!
Let’s take the following use case:
Maybe you’re looking to book a piece of equipment located in Dallas.
Since you also want to keep track of the equipment, and you want the project managers to know this stuff, you can add both of those things – location and reference number – as separate custom data fields. Once any project manager clicks on the resource, they’ll know that it’s the piece of equipment in Dallas with the reference number 35750.
This makes it easy to create a working capacity plan and ensure that the right resource is booked for the job. Since they’ll see right away which piece of machinery they are booking. And not accidentally scheduling the wrong one located in New York.
All the data is there, out in the open. The manager can use it and allocate resources.
Taking customization a step further:
You can use the information you have added to group resources, filter them, and create all sorts of views. Views of resource allocation at a location, in a department. You can filter out a type of equipment and save what you see as a view.
In addition to all this fun, you can also use resource custom data fields for calculations using reports. You can make reports calculate how much to pay to a specialist etc.
Projects
Project custom data fields come in handy if you are working with some other management tools alongside Ganttic.
Let’s say the sales team just submitted a proposal for a project. It’s in the system, but you need to check resource availability. You add the project, copy the project reference number, choose the location and the department from the drop-down menu. You choose proposal for the project status and choose yourself as the project manager that’s in control of the project.
Other managers will instantaneously see if you start dragging and dropping Gantt charts to book resources for the project. The whole story can be told without Excel spreadsheets and email threads.
Take it a step further:
Project custom data fields, namely date type project custom fields, are where to go if you need to add milestones to your projects.
Just make sure the ‘Show as milestone’ button says ‘ON’, and the dates you choose for each project will be displayed as milestones on the Gantt chart area. If you are using sync to marry Google Calendar and Gantt charts, you can sync the location of the event through link type custom data fields.
And that’s not all! Remember when you chose the project status from the drop-down menu? You can assign a color to every status on the list, and you can use those colors to get a quick overview of your project statuses.
“Work smarter, not harder” is a phrase that should be retired. Because actually your software should be working smarter and harder for you.
Just as children are told to get along with one another. So do our work tools. Not only is it super convenient to get a GCal notification about your upcoming project deadline. But I’m sure your team appreciates it too. Plus, it saves you the trouble of reminding them.
So do you need to keep it simple? Something such as syncing your Gantt chart to Google Calendar or Outlook. Or to your ERP, CRM, or other favorite acronym software?
If that’s the case look for options with APIs or Zapier, allowing you to build your own custom integrations.
Question #6: How much time do you want to save?
We aren’t quite to the point where AI is running our daily lives. And with most planning tools, scheduling and booking projects, tasks, and resources is still very much a manual process.
But unlike Gantt chart template makers built in Excel for example, dedicated software has more than a few tricks that can cut down on your planning time.
Three basic examples of time-saving features widely used are recurring tasks, project templates, and automatic reports.
Recurring Tasks
How often do you have the same tasks that appear week after week? And how much time does it take to plan these tasks?
If your tasks are often recurring, be on the lookout for a tool that allows you to copy tasks. Or better still, set them as an automatic recurrence. That way you don’t have to make your daily, weekly, or monthly planning sessions more tedious than they need to be. This software should save you time, not eat it up with unneeded tasks.
Project Templates
Similarly to recurring tasks, how often are your projects the same? If you’re engaging in projects with similar tasks, workflows, and requirements, then project templates might be a good solution.
By creating project templates with your unique specifications, you can save the time and headache of planning from scratch. But since they are tailored to your exact needs, it won’t feel like a plan-by-numbers scenario.
Automatic reporting
Reports are one of the worst parts of a PM’s job. Wouldn’t it be great to cut them out entirely? Unfortunately that’s probably not likely, but automatic reporting is maybe the next best thing.
Do you normally combine any monthly or weekly wrap-ups manually? If yes, then be on the search for software that does them automatically.
Utilization, projects, budget and more can all be selected for a report that occurs at your pre-selected time frame. Just turn them on and they’ll appear in your inbox at the interval you have chosen. Or to the inbox of your boss, saving you yet another step!
Question #7: Where Can I Make a Gantt Chart for Free?
Gantt charts are the number 1 tool of project management offices (PMO). Making them a favorite feature of today’s project and resource planning tools. By clearly displaying projects, timelines, dates, dependencies, and resources, they illustrate the work breakdown structure (WBS) of your upcoming activities.
And with their popularity means there’s plenty of Gantt chart makers available for every use case, budget, or industry.
Question #8: What’s your budget?

When considering your budget, there’s 3 basic choices.
- Free Gantt charts templates
- Freemium Gantt chart software
- Gantt chart SaaS
Free Gantt charts templates
Not ready to take the plunge just yet? Then there’s plenty of free tools you already have that can made into a Gantt. For example, you can try transforming your Google Calendar into a Gantt chart.
Or trying out some Gantt chart in Excel templates, most of which are free.
But if you do decide to stick with spreadsheets for project planning, be wary of potential consequences. Not only is Excel itself pricey, but it can lead to pricey mistakes that can send your projects over budget. Without dedicated utilization features, you risk overbooking team members, overlooking concurrent tasks, and flubbing your long-term plans. Is saving a few bucks a month really worth that?
Freemium Gantt chart software
Freemium is one step removed from free. And there is plenty of dedicated software that allow you create Gantt charts for free. There may just be a few restrictions, however.
For example, maybe you can only have a certain number of users with the free plan. Or a limited amount of projects. Likewise you may find a cap on the number of resources you can plan with. Or perhaps certain features are locked.
There’s also tons of free Gantt chart makers out there, and it might be worth checking out if their free plans satisfy your needs.
Gantt chart SaaS
On the flip side of this, is paying for a subscription to a dedicated Gantt chart tool.
Great plans usually don’t come for free. But that doesn’t mean you need to break the bank either. It’s not uncommon to see software chock-full of features, most you’ll never even touch. Just to off-set the high price of implementation. So consider carefully what Gantt chart creator features you actually need.
Most software-as-a-service (SaaS) comes with a free trial. So you can see if it fits your workflow and needs. Always try before you buy!
There’s no such things as stupid questions…
Only stupid answers. Or even dumber, not asking any questions at all!
If you’re in the market for a Gantt Chart maker, there are a lot of questions you need to consider and decisions you need to make in the process. For help considering which specific features you need from an online planner, check out our article on finding the best Gantt chart.
Don’t let analysis paralysis get the best of you. Ask the right questions, not only to yourself, but reach out to customer support as well. Most planning software offers free trials, so even if you don’t know the answer to your questions yet, you can see for yourself what exactly you need.
Ganttic: A Fully Customizable Gantt Chart Maker
 Ganttic is an online Gantt chart maker with more than 12 years experience.
For more than 13 years and with more than 100,000 users worldwide, Ganttic’s dedicated resource planner has been helping clients make the best Gantt charts.
Create visually striking, colorful charts that will help you make your projects’ deadline and budget. With features for resource scheduling, project management, and high level strategic PPM, Ganttic has what you need.
Want to learn more, sign up for a free demo. Or try it yourself for free for 14 days.
May the Gantt charts be with you!