Resource planning metrics help you track and evaluate the performance of your tasks and projects. Without measuring our projects and their results, it’s difficult to impossible to assess their success. And it’s only by monitoring and measuring the right metrics, are we able to see our team’s effort. While also redirecting the processes if need be.
Here’s 6 of the most crucial resource planning metrics that can aid in building a more efficient workplace.
Importance of Resource Planning Metrics
No matter your business’s size or industry, planning metrics are important. Without them, how would you know:
- Your profits;
- How your resources are performing;
- Whether your projects are on-time;
- If you’re within budget;
- What projects you can take on next quarter.
So while it’s not advisable to blindly rely on statistics and data, they do represent an important way to get feedback and make improvements. This also means that when choosing how to measure your results, there’s a lot that needs to be considered. But don’t worry. We can help!
Selecting Resource Planning Metrics
Before you can implement measurement indicators, you need to decide which ones are best for you. So how do you select your resource planning indicators? There’s a few ways.
- You can use SMART goals to more objectively measure whether your goals can be accomplished. In this case, letters in the acronym S.M.A.R.T. can tell you whether the metric you want to use are
- Specific enough,
- Measureable,
- Achievable,
- Relevant,
- realistically Time-bound.
- You could align metrics to use with the overall strategy of your company. A way to do this is by looking at some of the techniques of to project portfolio management.
- In conjunction with selecting the right resource planning metrics, individuals can significantly enhance their analytical skills by exploring comprehensive online training like power bi courses. These trainings empower project managers and stakeholders to effectively visualize data, adapt strategies in real-time, and drive project success with impactful reports and dashboards.
- You can collaborate with your stakeholders first. And with the help of a project communications plan, you can see which stakeholders are more important at different phases of the project or the resource planning cycle.
- You as the project manager can set a few KPIs just for your team. If successful, these may even end up as the indicators used throughout your company.
A word of warning on resource planning metrics
However you decide which planning metric to use, heed the warning of Harold Kerzner, the author of Project Management Metrics, KPIs, and Dashboards. He wrote that,
“Providing too many metrics and KPIs may be an invitation for stakeholders to micromanage the project.”
As such, more metrics do not equal better performance. Instead, select the ones that serve a purpose and don’t go overboard with them. So, be careful to not be overly reliant on these. Because these tend not to be very dynamic, and can’t always account for last-minute changes.
Whichever ones you do choose, though, follow them through and be sure to track them for the best results. Next, we’ll suggest a few metrics you may consider implementing as they can show you important information about your project.
The Best Metrics for Projects and Resources
We’ll keep it pretty simple and limit the number of planning metrics to 6. They will be broken down according to what exactly they measure. Our top resource planning metrics are:
- Cost Variance
- Resource capacity utilization
- Group and project portfolio utilization
- Planned resources vs. resources in use
- Planned time vs Used time
- The Doomsday Metric
Cost Variance
We can start with what may be considered one of the most important metrics of them all, cost. Not only is this important for stakeholders, but staying within budget can make the whole team happy as well.

Cost variance definition: measures the budgeted amount against the actual costs that were spent on a project or task.
Used in: individual project and resource management.
Why use it?
Achieve better planning accuracy
There’s not much that’s more important to a company than their money. This indicator can be your first hint that your projects and plans aren’t working. Are you over budget or under? How much more can you comfortably spend on a project before you’re in the red? If you’ve already used a third of the budget in the first few months of a year-long project, you might be in for a rough time.
Evaluation & predicting
Cost variance is useful when evaluating how each of the resources fit into a project and if some are more cost effective than others. It’s important when you need to reevaluate. And need not only a quick indication of a project’s progress, but a resource’s worth. It’s also helpful when making predictions, as you’ll have a more accurate picture of what future costs will look like. Or as a way to account for certain trends throughout the years.
How to use it?
To calculate the cost variance, you only need to compare the planned budget to the actual budget. Although this sounds easy, it can get more complicated the more projects, resources, and variables you have. Though on the flip side, the more details you compare, the more you can get from this KPI.
With Ganttic, the software can tabulate the amount for you. With just a few simple clicks in the reporting section. Or you can automatically set it so a report can be generated at any time interval that suits you. All you need to do is fill in your resource cost information, via custom resource data fields. Then, log in the actual used time while a personalized report is created for you.
A weekly report can be a quick and stress-free way to view your progress and keep track of your budget. The reports can also be shared with stakeholders. So everyone who needs to know, is “in the know.”
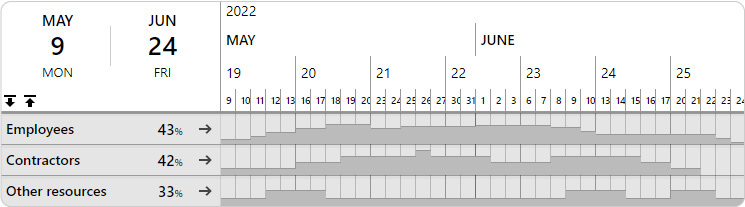
Resource capacity utilization
Utilization is generally shown as percentage (%) and is how much a resource is used. Below are some great metrics which look at resource capacity and utilization.

Resource capacity utilization definition: Resource capacity utilization is the percentage of a resource’s work hours occupied by projects or tasks. Utilization planning is the part of resource management that makes it possible to maximize resource efficiency.
Used in: Resource capacity utilization metrics are part of project management and high-level resource planning.
Why Use It?
Foundation for other metrics
Resource capacity utilization is the most fundamental resource planning metric. Additionally, it can maximize resource efficiency in individual projects and in your project portfolio. Resource utilization makes it possible to other utilization-related metrics. Add up the utilization of a specific team to get group utilization. Or add up the utilization of all the resources that are working on a project, to compare if the utilization is in check with the priorities in the portfolio.
Track your planning
Resource utilization is also important on its own. Analyzing ‘used time’ will indicate the effectiveness of the planning. As well as how correctly you have estimated the task duration after the assignments are complete. Utilization percentage is a metric you should keep track of while scheduling.
How to Use it?
There’s two calculations to find out your resource’s capacity utilization:
– Scheduled or Forecasted Utilization:
Scheduled Utilization = Scheduled time/ resource capacity
- Actual or Reported Utilization:
Actual Utilization = Reported time/ resource capacity
In Ganttic, utilization percentage is displayed next to the resource title. And it’s updated whenever a new task is scheduled. Resource utilization optimal if the utilization is between 90 and 100% for tools and equipment. And around 70% for people.
And since we’re on the subject, a word of warning. Remember, it’s not healthy to assume that productivity is going to be at 100% at all times. This kind of planning will only lead to burnout faster. And what appears to be more productivity in the beginning, quickly becomes more stress, staff. shortages, and higher turnover.
Real Life Case Study
In the case of human resource utilization, take some advice from a pro. The resource manager of our client Innopolis Engineering recommended,
“I guess in resource planning many project managers make the mistake of booking people at full capacity. However, in reality, employees get sick, or they have inspirational coffee breaks, trainings, or different courses. This means that on average people work 6.5-7 hours per day, not the full 8 hours. Taking that into consideration, I have set the work time to 7 hours in Ganttic.“
While scheduling, you can sort your resources according to the utilization percentage. By doing so, you’ll be able to reallocate resources if someone is overbooked and add tasks to those that lack responsibilities. If you are looking for a resource with a certain skill, you can add a filter with that skill to find out if there are unoccupied resources with the appropriate skill set.
Group Utilization and Project Portfolio Utilization
Group utilization definition: Group and project portfolio is how well groups of projects or your project portfolio is utilized. Much like resource capacity utilization, it is measured as a percentage. And changes depending on your grouping.
Used in: High-level planning, groups of projects or project portfolios.
Why use it?
Tool for comparison
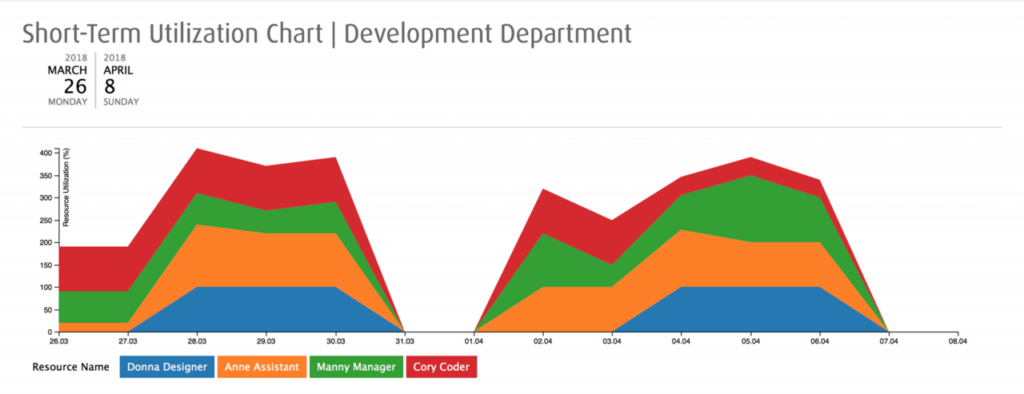
Keeping track of group utilization, in addition to individual utilization, is a powerful tool. One which will enable you to compare the utilization of different groups. As such, you’ll discover which groups are working most efficiently. Let’s say you are comparing the utilization of the different departments of your organization. You find out that the development department has a much higher average utilization than other departments.
Schedule based on availability
While scheduling, you can sort your resources according to the utilization percentage. By doing so, you’ll be able to reallocate resources if someone is overbooked. Or add tasks to those that lack responsibilities. If you are looking for a resource with a certain skill, you can add a filter. That way you can easily find out if there are unoccupied resources with the appropriate skill set. And always match the right resource to the right task.
Never miss a detail
Even if you keep a close eye on resource group utilization, you might miss a problem with a particular project or several concurrent projects. The problem with utilization is that it adds up. In a multi-project environment, it can cause a problem where resources can be optimally utilized for each project but are overutilized when all the ongoing projects are taken into consideration. The most debilitating part here seems to be that not all the resources are planned with the same resource scheduling software. If there isn’t an organization-wide PMO or a resource manager, a lot is left for the team members to figure out between themselves. However, this is made easier if your software is used which helps with transparency and keeping everyone on the same page.
How to use it?
Custom Groupings: Departments
In Ganttic, you can build custom resource groups including department, team, location, etc. Each resource can be in multiple resource groups that can be analyzed separately by choosing the group in question.
Custom Groupings: Projects
With the right project portfolio management software, it’s simple to get a comprehensive overview of the resource utilization across the portfolios. With plenty of insight into how the projects are laid out.
Resource Utilization Charts
Another thing that you could do is create a chart where you select resource utilization as chart values and project titles as chart data. As you can see on the screenshot below, June would have been a pretty sad month for this organization
Planned Resources Vs Resources in Use
Planned vs used resources definition: Planned resources are the estimated number of resources you will use in a given task, project, or strategy. Resources in use are the actual resources being used.
Used in: Project management and high-level resource planning
Why use it?
Track your resources
Estimating the number of resources needed for the next projects is one of the first steps to better efficiency. Whether you are planning resources for a project. Or if you are keeping an eye on the general resource allocation. After some time has passed, you’ll reach a milestone or the end of the project. Then, you can compare the original and the current state of the resource schedule.
This is one of the easiest resource planning metrics to employ. Yet, doing so will give you insight into your initial estimates. Armed with this knowledge, you can evaluate the health of the project. As well as your planning effectiveness. Not to mention, you’ll know where your resources are at any given time. This allows you to keep an eye on what everyone and everything is doing.
Better long-term planning
Once you have a better idea of how your resources are actually used, you can employ this knowledge in more strategic long-term planning. This metric gives you a more accurate picture of your actual resource utilization. So when preparing for next quarter’s projects, you’ll be equipped with a better understanding and a more reliable prediction for what to expect.
How to Use it?
In Ganttic, you can monitor this metric by running a report at the start of the planning period and when reaching a milestone.
Planned time vs Used time
Planned vs used time definition: Planned time is the estimated timeframe of your task, project, or strategy. While, used time is the actual timeframe in which your task was accomplished.
Used in: individual project and resource management.
Why use it?
More accurate forecasting
This metric helps with your long-term planning and forecasting. In order to assess how long a task will take, you need to know the number of projects your team will be tackling. So, when you have more accurate time tracking, you can make better estimates.With this planning metric you can help your team to not be overburdened. While ensuring that no one is taking on too many projects at once. With a better understanding of how long projects and tasks actually take, then you can stagger your projects most efficiently. This will ultimately help optimize your resources’ productivity. And get a better output.
Grow your company
Also, if you are looking to grow your company, it’s beneficial to compare what you think can be accomplished versus what you can accomplish. While optimism never hurts, wouldn’t you sleep better knowing you have the most accurate prediction available to you? I bet you would!
How to Use it?
In the project management context, the project team usually has to log the time they actually used to complete a task. In Ganttic, this can be done using the used time feature.
Below we’ll give you a step-by-step on how to achieve this:
- Once the assignee starts with the tasks, they should start keeping track of the time they are spending completing the task. Use the API or Zapier to connect Ganttic to a time tracking tool.
- When they complete the assignment, they can log the time in Ganttic.
- If this process is consistent, the time that the team members logs can be measured against the time initially planned.
- Next, you can draw up a new resource planning report. Or use an existing resource planning report template to analyze the two indicators against each other. To achieve that in Ganttic, you create a project-driven report. Filtering out the project in question.
- You should add the resource name into the grouping level and other data you might need. For example, the resource group, task status to know if the task is “complete” or “in progress.”
- Next, drag both “busy time” (planned time) and “used time” (the time that the team has logged) into the details level.
- Adjust the calendar, and click “Show report.”
If All Else Fails…The Doomsday Metric

Doomstay metric definition: Not really a planning metric per se. But a measurement of when to call it quits on a project. And a “when to vacate the premises” metric.
Used in: individual project and resource management.
Why Use it?
Cut off dead weight
Between 30 and 40% of projects don’t reach the original goals. Nor are they completed within the original budget or the timeframe. However, not all projects that don’t reach these goals are unsuccessful.
There are plenty of reasons why projects fail. And for many large projects, bringing it back might be more costly than its worth. This is the case when the costs for bringing the project back are no longer aligned with the benefits. Or when the goals of the project will not serve a purpose anymore.Keeping a project live that should be killed, is keeping valuable resources imprisoned. As well as draining the budget of funds that could be used on other projects. That is why a process should be established to make it easier to pull the kill switch. To do this, you should also establish metrics that indicate when a project is in trouble.
What is the Doomsday Metric?
There’s no standard process for killing a project. However, Harold Kerzner suggested 23 early warning signs that might indicate that the project requires further attention.
23 Warning Signs Your Project is in Trouble
1. Business case deterioration
2. Different opinions on the project’s purpose and objectives
3. Unhappy/disinterested stakeholders and steering committee members
4. Continuous criticism by stakeholders
5. Changes in stakeholders without any warning
6. No longer a demand for the deliverables or the product
7. Invisible sponsorship
8. Delayed decisions resulting in missed deadlines
9. High-tension meetings with team and stakeholders
10. Finger-pointing and poor acceptance of responsibility
11. Lack of organizational process assets
12. Failing to close life cycle phases properly
13. High turnover of personnel, especially critical workers
14. Unrealistic expectations
15. Failure in progress reporting
16. Technical failure
17. Having to work excessive hours and with heavy workloads
18. Unclear milestones and other requirements
19. Poor morale
20. Everything is a crisis
21. Poor attendance at team meetings
22. Surprises, slow identification of problems, and constant rework
23. A poor change control process
At any of these points, some organizations might choose to bring in an external consultant. This is strongly recommended. Since it will give you a perspective of someone who regularly analyzes projects that might be in trouble.
How to Use it?
Automate Reports
Software can also help. Resource planning tools like Ganttic can generate automatic reports that allow you to research a number of these warning signs. You can track who shows up to meetings. The percentage of missed deadlines. The turnover of employees. Or check on the amount of overtime.
Resource Planning Metrics- Use Them Wisely!
It’s up to you and your company what resource planning metrics and KPIs you decide to use. This list of 6 is by no means comprehensive. But should give you some good ideas about what you can, and perhaps even SHOULD measure. Keep in mind that although these indicators are important, there’s a human factor that goes into running a company. So use them wisely!
It’s also helpful if you pair these metrics with some great planning software. Programs such as Ganttic can do some of the hard parts, so actually putting these metrics into practice can be a breeze.