Scheduling with a Gantt chart is one of the most popular ways to manage your resources and project portfolio. But maybe you still find yourself wondering what exactly a Gantt chart is, how they are used, and what information they can convey.
Well, you’re in luck!
This quick guide will give you everything you wanted to know about these handy tools. And hopefully by the end, you’ll see how the modern Gantt chart is able to help any and all of your project planning and scheduling needs.
Planning and scheduling with a Gantt chart
Planning in project management is a necessity. And so are Gantt charts. So whether you are new to project planning or already an experienced project manager, it’s likely that you’ve heard of these tools. In fact, it’s also likely that you’ve already done some project scheduling with a Gantt chart.
Most of today’s standalone web-based software has the advantage of having critical project management features, including the Gantt chart, readily available. Which is great in today’s challenging and dynamic work environment. All you need to do is choose the right tools.
Just imagine being a project manager hundreds of years ago, and trying to build the Taj Mahal or Sagrada Familia without modern planning tools. No wonder they took hundreds of years to complete!
Nowadays it’s possible to use modern Gantt chart planning to better manage your project resources and control for unexpected situations. There’s a reason why we still use this solution. Because even after a century, we still haven’t been able to think of a better alternative.
Let’s dive a bit more into the history of these charts.
Background of Gantt charts
What’s in a name? Well, you may be interested to learn that, the chart’s namesake, Henry Gantt, did not actually invent the Gantt chart. That honor actually goes to Karol Adamiecki from Poland. However, Henry Gantt designed the chart the way we know it today.
In around 1910, “The Gantt Duo” – Henry Gantt and his Gantt chart – introduced the world to better tools for project management, control, and planning. Shortly after that, the chart was used for planning military operations during WWI. And even the Hoover dam was constructed with the use of this handy tool!
What is a Gantt chart?
There are many definitions of a Gantt chart. But at its core we can say that they are a tool used to illustrate project progress, deadlines and elements.
- A Gantt chart is a visual project management tool that helps to plan and schedule projects of every size.
- Gantt charts look like a horizontal bar chart that shows project management timelines, task starting and ending dates, dependencies between different tasks, and general project task flow.
- It is a visual interpretation of the project which gives an overview of the project’s progress, timeline, and tasks over its entire time frame.
Gantt charts of today and tomorrow
Modern Gantt chart software is making the best of the charts’ simplicity, timeline, and visual overview. While giving the opportunity to add details about the project, project manager, the cost of the resources, and any other information your project requires. They also make the process faster, more efficient, and with less room for errors.
Another huge selling point is that online Gantt chart software gives the project manager the opportunity to continuously adjust the charts. Something that is part and parcel of the regular project flow.
We can say that the tool has been, (and still is) the easiest way to plan your resources and projects against a timeline. While simultaneously providing an overview and control over the different project phases. Modern Gantt charts are more convenient to handle and add information to, but the basic functionality has stayed the same since Henry Gantt’s times.
What are the elements of a Gantt chart?
To get the most out of your project and resource planning, here are some key components of a classic Gantt chart.
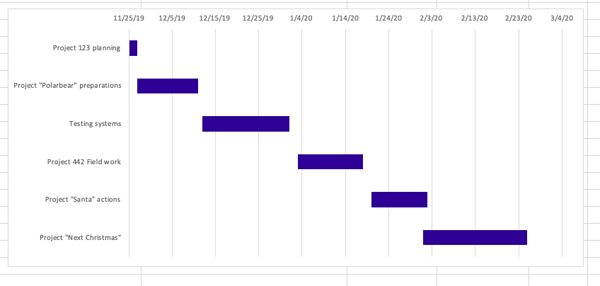 A simple, classic Gantt chart. The bars tell you when and for how long the different resources and projects are going on for.
A classic Gantt chart consists of:
- Projects dates and timeline – this gives project managers an overview of all the project dates. From the start, to dates connected with project tasks, and to the finish. You have the complete time frame at your fingertips!
- Gantt chart bars as project tasks – projects normally consist of different tasks and the Gantt chart is a great way to see them all in one place. A visual overview helps you make sure that everything is in the right place on the timeline and nothing is forgotten. Task names are normally set on the Gantt chart. Luckily, modern charts are made so that you can easily change the location and the length of the task bar.
- Milestones – milestones are the little “wins” of the projects. They are normally at the end of the task and hold some significance for the project. Usually, milestones are displayed as diamond-shaped – which feels like a bonus after the completion of the task.
ProTip: Always celebrate your little “wins”. They help to break your project into more achievable pieces.
- Dependencies – there are always tasks in your projects that need to be completed before the next task can begin or end. So one task is dependent on the other’s start or finish. In Gantt charts, dependencies between the tasks are shown with little arrows.
ProTip: dependencies can help you focus on the base tasks that are directly connected with the general project flow.
- Resources – In a classic Gantt chart, you can add a resource to your task to see who’s responsible for the task and who’s working on it. In modern Gantt charts, there are ways to make it more visual and understandable. It’s not rare to use Gantt charts for resource planning and project portfolio management, in addition to single project planning.
Modern Gantt chart features for planning and scheduling: The Ganttic example
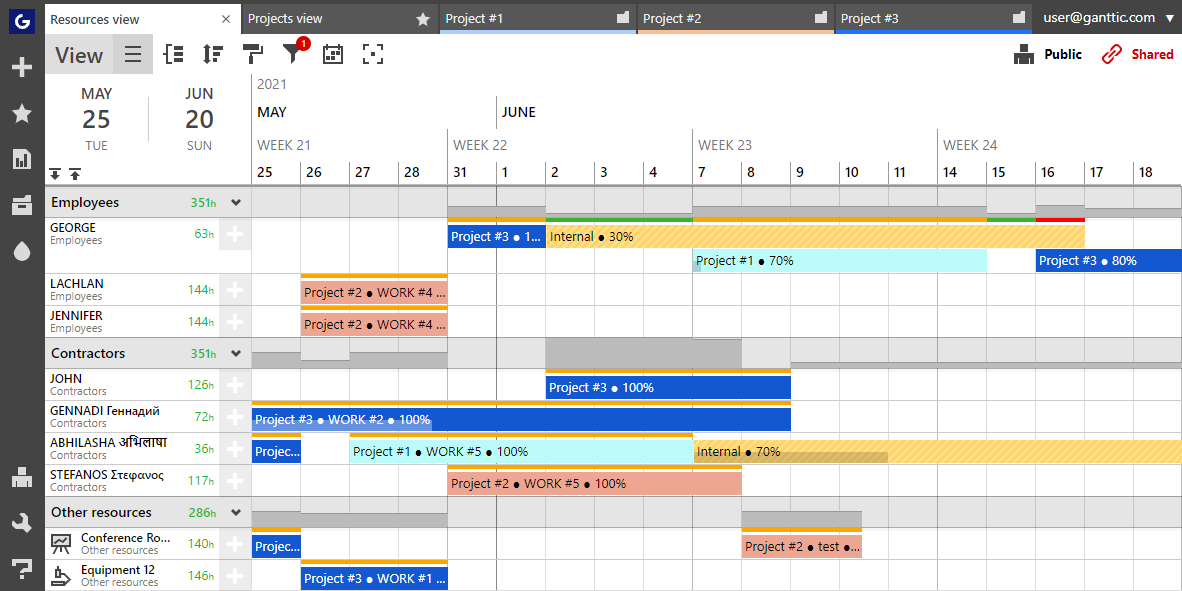 Ganttic is a resource-based online Gantt chart for project and resource planning
Gantt charts can help you not only with projects but also with resource management. You can schedule your people and other resources (such as machinery, rooms, tools, etc.) merely by assigning tasks to them. In this scenario, you can list your resources on the left (X-axis) and use the bar-charts to indicate the tasks and projects.
And since it’s rare to have just one project to handle at one time, modern Gantt charts keep project portfolio management (PPM) in focus. This means, it is actually easy to handle several projects at one time, with one view. By adding multiple layers to the charts, users can see the different projects overlaid on one another. Providing a broader overview of the tasks, resources, and progress.
Moreover, technology has made scheduling and resource reallocation a breeze. Most of today’s Gantt charts come with drag and drop scheduling, for quicker planning.
Yet, an added bonus of the charts is they have all the customization of spreadsheets but with none of the frustrations. Just one of the reasons why they are a great alternative to Excel.
There are several other Gantt chart features that can make scheduling easier and quicker:
- Color schemes – use it for tasks (combine tasks by colors), for projects (use different colors for different projects) or for stages of projects (red for “canceled,” green for “completed”). An overview of your project is one of the keys to success, and color coding your project management gives you a quick assessment of your needs and metrics. It’ll bring you one step closer to project success.
- Custom Data Fields – customize your projects, tasks, people, and other resources by their metrics that are important for their projects. It could be their skills, the year when certain machinery was bought, or the name of a project manager. This allows for your tasks and bar graphs to handle way more information. You graphs are more detailed and you can then use this info in your planning and reporting.
- Notes and history – you can write notes for the tasks and see the history of changes in tasks. This helps you avoid mistakes by keeping track of who made changes and to what. It is like a sticky note on your whiteboard… but happening in real-time, so everyone can see it!
- Utilization – planning allows you to use your time and resources more efficiently. In Ganttic you have an overview of the utilization of ALL your people and resources. This lets you ensure that nothing is overbooked or gives you the option of taking unused capacity from another project. Efficient planning is growth planning.
- Reports – sometimes not only the graph but the tables of calculation can be helpful, so you can actually calculate the hours, utilization, durations and many more. Plus, a lot of times you can choose to even automate your reports, so you’ll get them at the time interval you want. Let the program do the work for you, so you can focus on other things.
- Flexible timeline– since Gantt charts are not drawn manually on paper anymore, there are programs that let you play around in your timeline. If you need to see today’s plans, just zoom in. When you need to understand the next month’s plans or schedule next year’s project, just zoom out. You are the project manager who handles your projects, not the other way around!
Pro Tip: We strongly suggest giving Gantt charts a try when you need to make plans involving people and resources with different skill sets. Check out some advice on choosing the right Gantt chart maker.
8 reasons to do your scheduling with a Gantt chart
It is not a coincidence that Gantt charts have been used for as long as they have. They were made for planning. As the top tool of project managers, they offer plenty of benefits.
Here are the TOP advantages of Gantt chart in scheduling management with Gantt chart software :
1. Get a visual overview about the whole project

Perhaps you have tens or even hundreds of resources to manage. All of which requires an overview. And maybe you share these resources with other project managers and you need software that helps you all to succeed. Gantt charts not only help with the overview, but the best ones give you automatic calculations about your planning metrics and KPIs. Such as resource utilization, which prevents the risk of overloading your team or equipment.
Having an instantaneous, sharable visual overview of these dates, bookings, and availability will let everyone sleep better at night.
Most jobs require us to multitask. So if you’ve ever needed to be in two places at the same time, you can understand what a pain that must be to plan. And why double-booking a room or piece of equipment isn’t uncommon. Mistakes happen! Especially when stress is involved.
Luckily, Gantt charts actually give you get a great overview of everything that is happening, when it’s happening, and who is involved. This can help you avoid the nightmare of double-bookings. Plus the best ones make it possible to schedule tasks concurrently, for those times when multitasking is unavoidable.
3. Use your resources more effectively
Growth and results only happen if you find strategies to be more effective. Gantt charts can help with this by giving you a better overview of your resources, how they are in use, and when they’ll be free. This info helps to plan activities ahead of time. Plus, gives you the chance to handle upcoming problematic phases before they become issues.
See some upcoming bottlenecks? Or is there a potential shortage? Add a few extra resources. Better capacity management now prevents more serious issues later.
Likewise, seeing how your resources interact with the graph’s timeline helps you make better decisions. This in turn can give you the opportunity to secure more profits. More money, less problems!
4. Agile and real-time changes
As previously mentioned, modern Gantt charts are not the same as when they were hand-drawn. Online Gantt charts with drag and drop enable users to make charts in a flexible way. And one which can easily adapt to changes. Making them a perfect fit for those who prefer an agile management style.
Better still is that Gantt charts can be paired with Kanban boards. Another favorite of agile project managers. Use them in a way that’s most comfortable for you. And with the tools that enhance your workflow.
Pro Tip: Look for Gantt chart software with built-in integrations, and API, or Zapier connection. Then build your ideal workflow.
5. Keep an eye on future, long-term planning
Gantt charts let project managers see the bigger picture for the future. When should another task start? How far along are we with Task X? Are there any resources missing? Or if someone is ill, how we can find a replacement for him for next week? The charts can help to give us the directions for the future, now, and makes long-term planning easier and less stressful. While also making it look easy for project managers.
6. Solve the problems before they happen
Problem-solving is a critical task for a project manager. It is way easier to solve problems ahead of time instead of in the middle of a crisis. Gantt charts help sort out the bottlenecks before they occur. Lack of resources, an overload of work, timing issues? Problems always occur, but it’s best to solve them ahead of time while they are still “invisible.”
7. Illustrates task and project dependencies
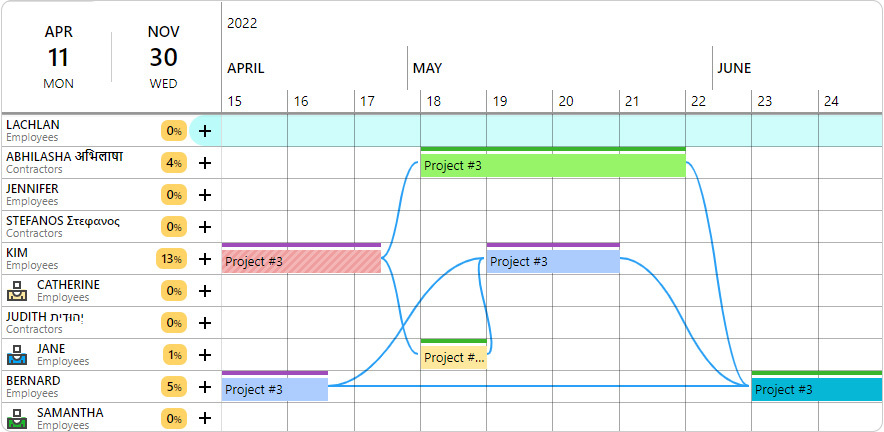 Gantt charts illustrate workflow with task dependencies.
You can’t start building a house without a foundation. Same goes for projects. Sometimes there’s tasks that need to be handled first. Gantt charts help to visualize the dependencies between the tasks. This allows you to understand what is starting, what is changing and what is ending. And how all these might affect other dependencies. Or the whole project or the portfolio.
8. They are used in every industry
Gantt charts are great because they are versatile. There’s a reason they are so popular, it doesn’t matter if you are in a creative industry, or engineering, IT, or construction, working in a lab or in a sound booth. You can easily customize the charts to fit your needs. Plus, modern cloud-based solutions make it easy to sign-in and update even when you’re on-the-go, and can be a great option for varied work conditions such as coordinating hybrid models and virtual teams.
Disadvantages of planning with a Gantt chart
Although there are many advantages to using a Gantt chart, there are of course some disadvantages as well. Keep these things in mind when using the tool for the most effective results.
It’s important to remember that:
1. Plans can get complex (and messy)
Of course, they can, that’s life. Especially when we are talking about dozens of different resources and hundreds of details within the scope of several projects. It might get tricky with all those dependencies. To the point where even the smallest changes can be time-consuming and difficult to manage.
So be careful to choose the right software to minimize the headaches that too much data can bring. However, we know that although it can get hard sometimes, it’s not impossible.
Tip to solve this:
Gantt charts are actually great at simplifying complex data.
It all depends on the way you customize your info and structuring it in a way that’s right for you. Look at your plans through different views or organize your resources using custom data fields. Different coloring options can also be the little tweak needed to help you get organized.
2. Gantt chart task bars don’t always show the amount of work
A week-long task does not necessarily mean a full 8h/day workweek. It may also mean that extra assistance is needed on some days. Or alternatively, that only half a day was used. Here the utilization percentage becomes important, to allow you to actually understand the true amount of work.
Tip to solve this:
Not every Gantt chart showcases resource utilization – so doing a bit of resource beforehand may be necessary.
But once you find a charts that does put a spotlight on resources – you’re in luck! Following your resource utilization, can help you to use the resources more efficiently and deliver those projects on time. Check out a few other ways you can monitor utilization to increase your planning and work efficiency.
3. Visibility of long-time period planning
Some projects take months. Others may take years. And it can be frustrating to not be able to see your entire portfolio when there’s differing lengths. Gantt chart tools with limited capabilities make it difficult to see the complete project portfolio on one screen or sheet. Especially if you’ve turned your Excel into a Gantt chart.
Tip to solve this:
The best remedy for this is Gantt chart software which allows you to zoom in and out with just a few clicks. A flexible timeline can make it super simple to see the exact time and date you need.
Time to get started with a Gantt chart
Projects are different. Companies are different. Resources and methodologies are different. But once implemented in your project planning, a Gantt chart can do some miraculous things. Outline how resources can be allocated and scheduled more efficiently and in the best ways for your specific needs.
At Ganttic we’ve learned from real-life experiences, practices, statistics, and feedback over the past 10 years. There are companies who do their planning only in Ganttic. And there are ones who use Ganttic in conjunction with other long term planning software such as ERP. Either way, online Gantt charts make better planning possible!
It turns out, planning and scheduling with Gantt charts may actually be one of the best solutions for resource and long term project portfolio management. Maybe even the best one.
May the Gantt charts be with you!